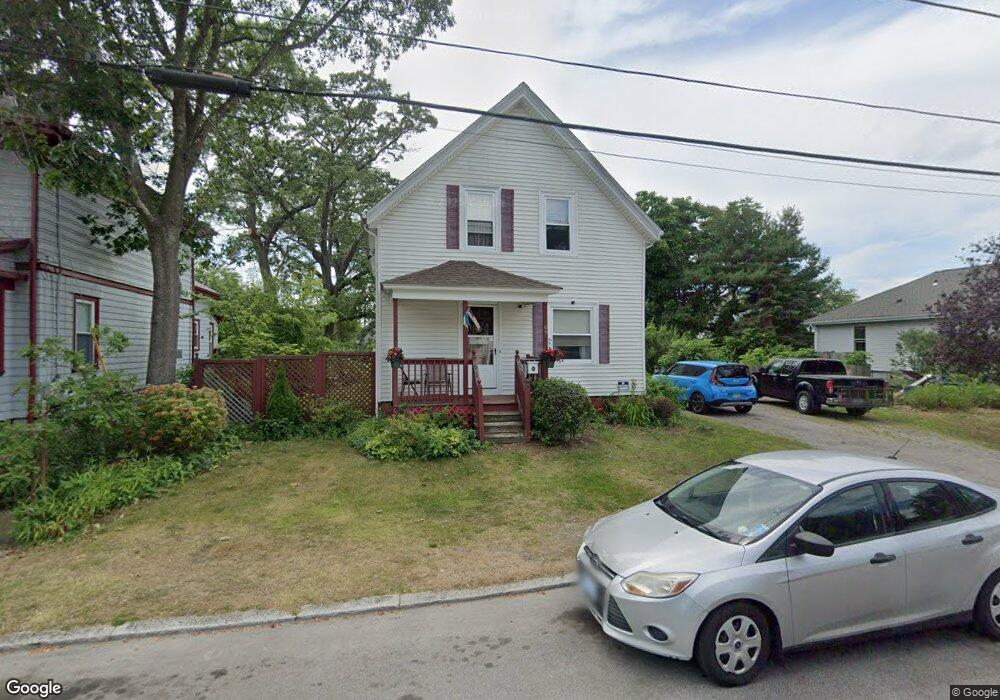
64 Downes Ave Pawtucket, RI 02861
Darlington NeighborhoodEstimated Value: $343,750 - $395,000
3
Beds
1
Bath
915
Sq Ft
$398/Sq Ft
Est. Value
About This Home
This home is located at 64 Downes Ave, Pawtucket, RI 02861 and is currently estimated at $364,188, approximately $398 per square foot. 64 Downes Ave is a home located in Providence County with nearby schools including St Cecilia School and Saint Teresa Catholic Elementary School.
Ownership History
Date
Name
Owned For
Owner Type
Purchase Details
Closed on
Feb 18, 2021
Sold by
Bagdanovich Michael
Bought by
Bagdanovich Michael and Bagdanovich Althea C
Current Estimated Value
Home Financials for this Owner
Home Financials are based on the most recent Mortgage that was taken out on this home.
Original Mortgage
$210,000
Outstanding Balance
$186,099
Interest Rate
2.7%
Mortgage Type
New Conventional
Estimated Equity
$178,089
Purchase Details
Closed on
Nov 18, 1999
Sold by
Oneill Joseph A
Bought by
Monahan John E and Almeida Victor
Home Financials for this Owner
Home Financials are based on the most recent Mortgage that was taken out on this home.
Original Mortgage
$30,000
Interest Rate
7.76%
Mortgage Type
Purchase Money Mortgage
Create a Home Valuation Report for This Property
The Home Valuation Report is an in-depth analysis detailing your home's value as well as a comparison with similar homes in the area
Home Values in the Area
Average Home Value in this Area
Purchase History
| Date | Buyer | Sale Price | Title Company |
|---|---|---|---|
| Bagdanovich Michael | -- | None Available | |
| Monahan John E | $45,000 | -- |
Source: Public Records
Mortgage History
| Date | Status | Borrower | Loan Amount |
|---|---|---|---|
| Open | Bagdanovich Michael | $210,000 | |
| Previous Owner | Monahan John E | $135,000 | |
| Previous Owner | Monahan John E | $102,000 | |
| Previous Owner | Monahan John E | $97,200 | |
| Previous Owner | Monahan John E | $30,000 |
Source: Public Records
Tax History
| Year | Tax Paid | Tax Assessment Tax Assessment Total Assessment is a certain percentage of the fair market value that is determined by local assessors to be the total taxable value of land and additions on the property. | Land | Improvement |
|---|---|---|---|---|
| 2025 | $3,673 | $279,300 | $141,200 | $138,100 |
| 2024 | $3,447 | $279,300 | $141,200 | $138,100 |
| 2023 | $3,178 | $187,600 | $74,600 | $113,000 |
| 2022 | $3,110 | $187,600 | $74,600 | $113,000 |
| 2021 | $3,110 | $187,600 | $74,600 | $113,000 |
| 2020 | $2,927 | $140,100 | $62,100 | $78,000 |
| 2019 | $2,927 | $140,100 | $62,100 | $78,000 |
| 2018 | $2,820 | $140,100 | $62,100 | $78,000 |
| 2017 | $2,556 | $112,500 | $47,100 | $65,400 |
| 2016 | $2,463 | $112,500 | $47,100 | $65,400 |
| 2015 | $2,463 | $112,500 | $47,100 | $65,400 |
| 2014 | $2,359 | $102,300 | $47,100 | $55,200 |
Source: Public Records
Map
Nearby Homes
Your Personal Tour Guide
Ask me questions while you tour the home.