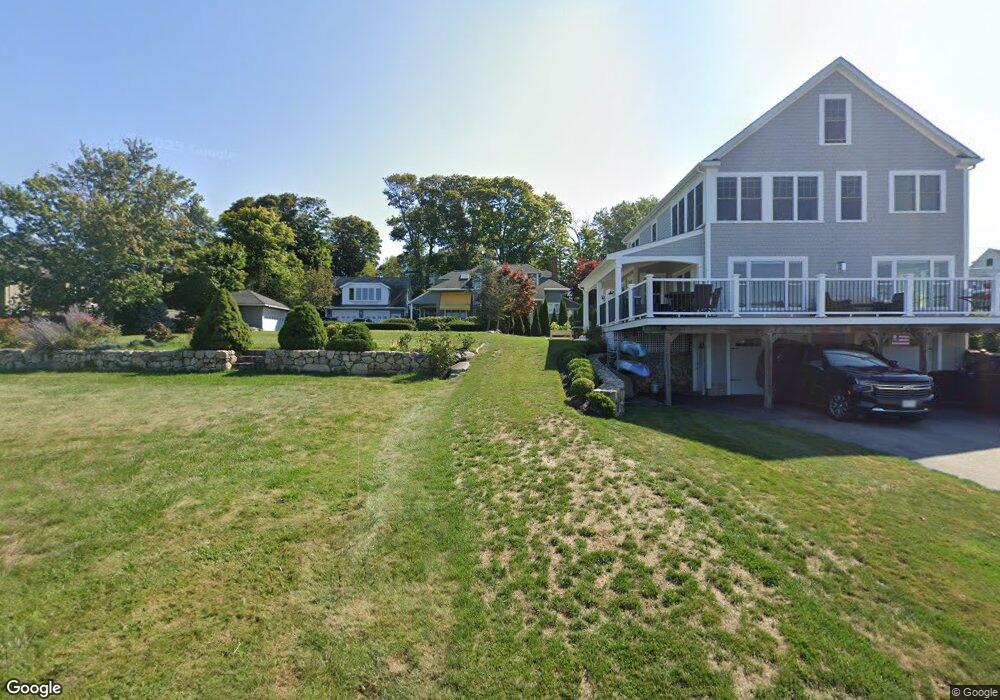
64 Edward Foster Rd Scituate, MA 02066
Estimated Value: $1,666,000 - $2,300,000
4
Beds
4
Baths
2,516
Sq Ft
$806/Sq Ft
Est. Value
About This Home
This home is located at 64 Edward Foster Rd, Scituate, MA 02066 and is currently estimated at $2,027,776, approximately $805 per square foot. 64 Edward Foster Rd is a home located in Plymouth County with nearby schools including Jenkins Elementary School, Lester J. Gates Middle School, and Scituate High School.
Ownership History
Date
Name
Owned For
Owner Type
Purchase Details
Closed on
Nov 10, 2009
Sold by
Hillman Ft
Bought by
Hillman Anthony R
Current Estimated Value
Purchase Details
Closed on
Oct 30, 2008
Sold by
Hillman Ft
Bought by
Hillman Ft
Purchase Details
Closed on
Oct 19, 1998
Sold by
64 Edward Foster Rd Rt
Bought by
Hillman John I and Hillman Kathleen
Home Financials for this Owner
Home Financials are based on the most recent Mortgage that was taken out on this home.
Original Mortgage
$360,000
Interest Rate
6.8%
Mortgage Type
Purchase Money Mortgage
Purchase Details
Closed on
Sep 14, 1992
Sold by
Knowles George I and Knowles Jeanne M
Bought by
Ball Leslie D and Ball Martha M
Create a Home Valuation Report for This Property
The Home Valuation Report is an in-depth analysis detailing your home's value as well as a comparison with similar homes in the area
Home Values in the Area
Average Home Value in this Area
Purchase History
| Date | Buyer | Sale Price | Title Company |
|---|---|---|---|
| Hillman Anthony R | -- | -- | |
| Hillman Ft | -- | -- | |
| Hillman John I | $487,500 | -- | |
| Ball Leslie D | $407,500 | -- |
Source: Public Records
Mortgage History
| Date | Status | Borrower | Loan Amount |
|---|---|---|---|
| Previous Owner | Ball Leslie D | $250,000 | |
| Previous Owner | Ball Leslie D | $360,000 |
Source: Public Records
Tax History Compared to Growth
Tax History
| Year | Tax Paid | Tax Assessment Tax Assessment Total Assessment is a certain percentage of the fair market value that is determined by local assessors to be the total taxable value of land and additions on the property. | Land | Improvement |
|---|---|---|---|---|
| 2025 | $18,506 | $1,852,500 | $1,235,500 | $617,000 |
| 2024 | $18,515 | $1,787,200 | $1,182,300 | $604,900 |
| 2023 | $17,649 | $1,618,600 | $1,074,800 | $543,800 |
| 2022 | $17,649 | $1,398,500 | $936,900 | $461,600 |
| 2021 | $17,277 | $1,296,100 | $892,300 | $403,800 |
| 2020 | $17,129 | $1,268,800 | $857,900 | $410,900 |
| 2019 | $12,947 | $942,300 | $560,700 | $381,600 |
| 2018 | $12,428 | $890,900 | $545,300 | $345,600 |
| 2017 | $12,226 | $867,700 | $522,100 | $345,600 |
| 2016 | $13,070 | $924,300 | $603,300 | $321,000 |
| 2015 | $10,893 | $831,500 | $510,500 | $321,000 |
Source: Public Records
Map
Nearby Homes
- 91 Front St Unit 106
- 23 Sunset Rd
- 12 Meeting House Ln Unit 308
- 50 First Parish Rd
- 76 A Brook St
- 76 A Brook St Unit 1
- 59 Greenfield Ln
- 67 Greenfield Ln
- 32 Barker Rd Unit 3
- 74 Tilden Rd
- 12 Richfield Rd
- 2 Collier Rd
- 105 Turner Rd
- 37 Moorland Rd
- 23 Oceanside Dr
- 23 Lois Ann Ct Unit 23
- 29 Ladds Way Unit 29
- 111 Elm St
- 115 Elm St
- 19 Ford Place Unit 3
- 3 Bridge Ave
- 9 Bridge Ave
- 2 Prospect Ave
- 6 Prospect Ave
- 6 Bridge Ave
- 1 Peggotty Beach Rd
- 1 Peggotty Beach Rd Unit one
- 11 Bridge Ave
- 1 Crescent Ave Unit Lot 1
- 1 Crescent Ave
- 10 Prospect Ave
- 6 Crescent Ave
- 16 Bridge Ave
- 9 Peggotty Beach Rd
- 56 Edward Foster Rd
- 8 Peggotty Beach Rd
- 7 Prospect Ave
- 21 Bridge Ave
- 22 Bridge Ave
- 14 Prospect Ave