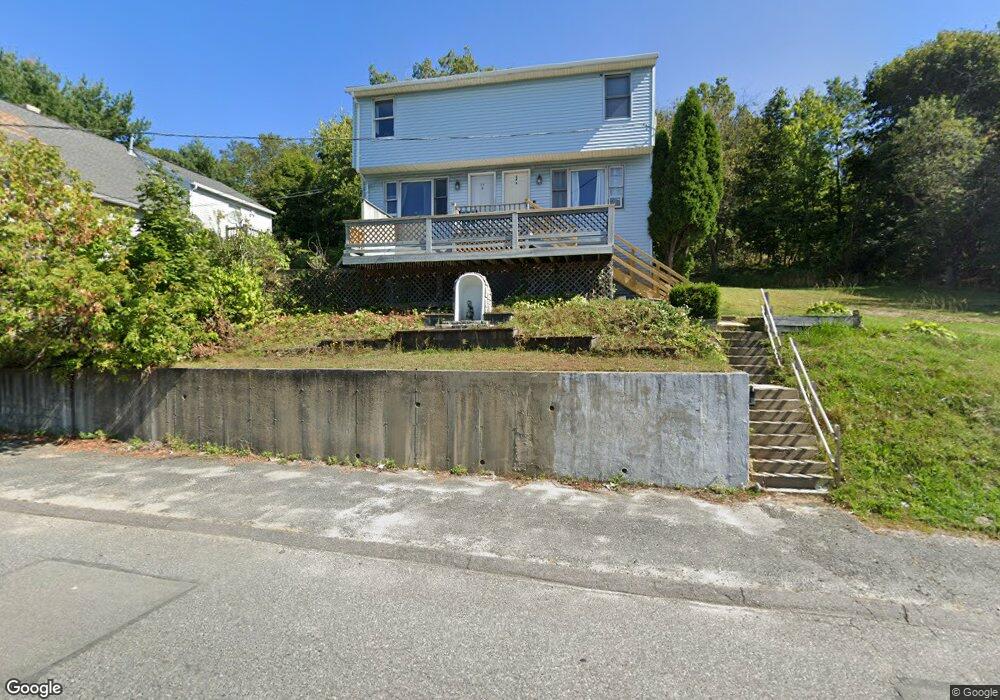
64 Orient St Worcester, MA 01604
Franklin Plantation NeighborhoodEstimated Value: $475,999 - $565,000
4
Beds
2
Baths
2,066
Sq Ft
$247/Sq Ft
Est. Value
About This Home
This home is located at 64 Orient St, Worcester, MA 01604 and is currently estimated at $510,750, approximately $247 per square foot. 64 Orient St is a home located in Worcester County with nearby schools including Jacob Hiatt Magnet School, Chandler Magnet, and Grafton Street.
Ownership History
Date
Name
Owned For
Owner Type
Purchase Details
Closed on
Sep 12, 2025
Sold by
Pongsa C J
Bought by
Pongsa Properties Llc
Current Estimated Value
Purchase Details
Closed on
Nov 7, 2008
Sold by
Kehoe John R
Bought by
Pongsa C James
Home Financials for this Owner
Home Financials are based on the most recent Mortgage that was taken out on this home.
Original Mortgage
$225,888
Interest Rate
6.08%
Mortgage Type
Purchase Money Mortgage
Purchase Details
Closed on
Oct 29, 1999
Sold by
Gemme Alan W and Gemme Madeline R
Bought by
Kehoe John R
Home Financials for this Owner
Home Financials are based on the most recent Mortgage that was taken out on this home.
Original Mortgage
$126,000
Interest Rate
7.78%
Mortgage Type
Purchase Money Mortgage
Purchase Details
Closed on
Sep 13, 1995
Sold by
Wester Mary S
Bought by
Gemme Alan and Gemme Madeline
Create a Home Valuation Report for This Property
The Home Valuation Report is an in-depth analysis detailing your home's value as well as a comparison with similar homes in the area
Home Values in the Area
Average Home Value in this Area
Purchase History
| Date | Buyer | Sale Price | Title Company |
|---|---|---|---|
| Pongsa Properties Llc | -- | -- | |
| Pongsa C James | $230,000 | -- | |
| Pongsa C James | $230,000 | -- | |
| Kehoe John R | $133,000 | -- | |
| Gemme Alan | $23,000 | -- |
Source: Public Records
Mortgage History
| Date | Status | Borrower | Loan Amount |
|---|---|---|---|
| Previous Owner | Gemme Alan | $222,452 | |
| Previous Owner | Pongsa C James | $225,888 | |
| Previous Owner | Gemme Alan | $166,000 | |
| Previous Owner | Gemme Alan | $126,000 |
Source: Public Records
Tax History
| Year | Tax Paid | Tax Assessment Tax Assessment Total Assessment is a certain percentage of the fair market value that is determined by local assessors to be the total taxable value of land and additions on the property. | Land | Improvement |
|---|---|---|---|---|
| 2025 | $5,685 | $431,000 | $81,200 | $349,800 |
| 2024 | $5,499 | $399,900 | $81,200 | $318,700 |
| 2023 | $4,989 | $347,900 | $70,600 | $277,300 |
| 2022 | $5,077 | $333,800 | $56,500 | $277,300 |
| 2021 | $4,368 | $268,300 | $45,200 | $223,100 |
| 2020 | $3,791 | $223,000 | $44,900 | $178,100 |
| 2019 | $3,766 | $209,200 | $39,200 | $170,000 |
| 2018 | $3,863 | $204,300 | $39,200 | $165,100 |
| 2017 | $3,877 | $201,700 | $39,200 | $162,500 |
| 2016 | $3,788 | $183,800 | $28,300 | $155,500 |
| 2015 | $3,689 | $183,800 | $28,300 | $155,500 |
| 2014 | $3,591 | $183,800 | $28,300 | $155,500 |
Source: Public Records
Map
Nearby Homes
- 13 Groton Place
- 5 Mcfarland Ct
- 34 Robin Rd
- 81 Pilgrim Ave
- 56 Plantation St
- 155 Hamilton St Unit 4
- 61 Cohasset St
- 9 Barclay St
- 35 Houghton St
- 80 Delmont Ave
- 57 Cutler St
- 112 Harrison St
- 247 Shrewsbury St
- 429 Grafton St Unit 2
- 21 Mott St
- 1 Verdi Rd
- 40 Aetna St
- 47 Barclay St
- 32 Providence St Unit 5
- 22 Waverly St
- 66 Orient St
- 31 Ridge St Unit 201
- 31 Ridge St Unit 100
- 31 Ridge St Unit 304
- 31 Ridge St Unit 301
- 31 Ridge St Unit 205
- 31 Ridge St Unit 107
- 31 Ridge St Unit 101
- 31 Ridge St Unit 109
- 31 Ridge St Unit 104
- 31 Ridge St
- 60 Orient St
- 60 Orient St Unit 60
- 67 Orient St
- 67 Orient St Unit 2
- 65 Orient St Unit 1
- 65 Orient St
- 65 Orient St Unit 3
- 69 Orient St
- 6 Shale St
Your Personal Tour Guide
Ask me questions while you tour the home.