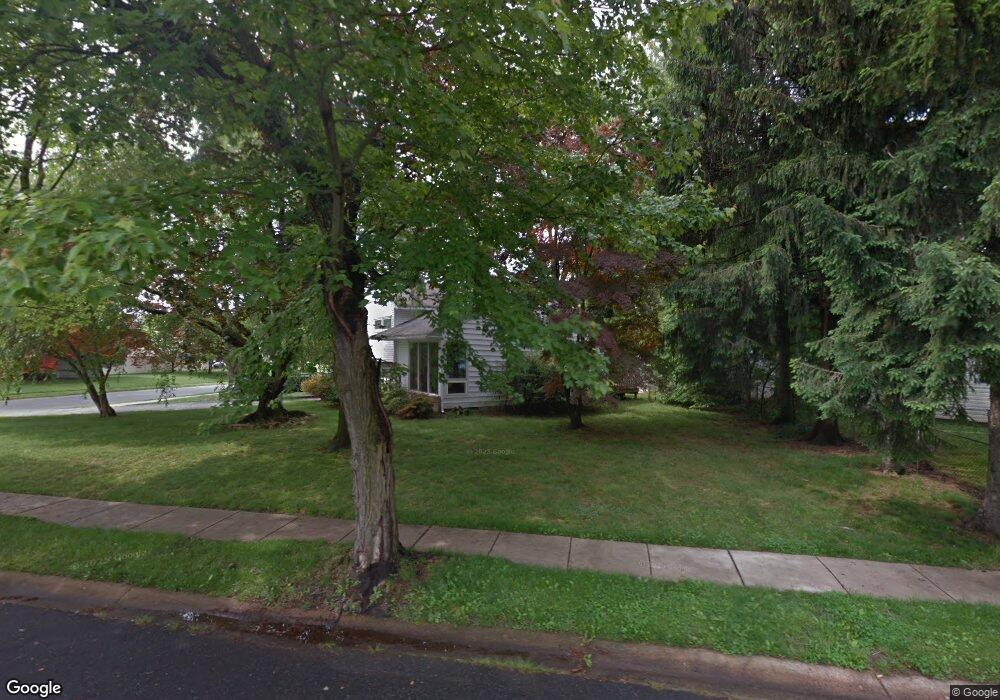
64 Ruby Dr Claymont, DE 19703
Estimated Value: $290,000 - $394,411
3
Beds
2
Baths
1,176
Sq Ft
$304/Sq Ft
Est. Value
About This Home
This home is located at 64 Ruby Dr, Claymont, DE 19703 and is currently estimated at $357,103, approximately $303 per square foot. 64 Ruby Dr is a home located in New Castle County with nearby schools including Claymont Elementary School, Talley Middle School, and Mount Pleasant High School.
Ownership History
Date
Name
Owned For
Owner Type
Purchase Details
Closed on
May 9, 2023
Sold by
Williams Darryl D
Bought by
Darryl D Williams Living Trust
Current Estimated Value
Purchase Details
Closed on
Oct 11, 2007
Sold by
Rafferty Timothy M and Boerke Debra L
Bought by
Williams Darryl D
Home Financials for this Owner
Home Financials are based on the most recent Mortgage that was taken out on this home.
Original Mortgage
$180,000
Interest Rate
6.39%
Mortgage Type
Purchase Money Mortgage
Purchase Details
Closed on
Jul 3, 2002
Sold by
Boerke Debra L
Bought by
Boerke Debra L and Vought Kevin E
Home Financials for this Owner
Home Financials are based on the most recent Mortgage that was taken out on this home.
Original Mortgage
$104,000
Interest Rate
7.15%
Purchase Details
Closed on
May 15, 2002
Sold by
Vought Dutton B
Bought by
Boerke Debra L
Home Financials for this Owner
Home Financials are based on the most recent Mortgage that was taken out on this home.
Original Mortgage
$104,000
Interest Rate
7.15%
Create a Home Valuation Report for This Property
The Home Valuation Report is an in-depth analysis detailing your home's value as well as a comparison with similar homes in the area
Home Values in the Area
Average Home Value in this Area
Purchase History
| Date | Buyer | Sale Price | Title Company |
|---|---|---|---|
| Darryl D Williams Living Trust | -- | None Listed On Document | |
| Williams Darryl D | $180,000 | None Available | |
| Boerke Debra L | $68,500 | -- | |
| Boerke Debra L | $130,000 | -- |
Source: Public Records
Mortgage History
| Date | Status | Borrower | Loan Amount |
|---|---|---|---|
| Previous Owner | Williams Darryl D | $180,000 | |
| Previous Owner | Boerke Debra L | $104,000 |
Source: Public Records
Tax History
| Year | Tax Paid | Tax Assessment Tax Assessment Total Assessment is a certain percentage of the fair market value that is determined by local assessors to be the total taxable value of land and additions on the property. | Land | Improvement |
|---|---|---|---|---|
| 2024 | $2,055 | $54,000 | $12,000 | $42,000 |
| 2023 | $1,878 | $54,000 | $12,000 | $42,000 |
| 2022 | $1,910 | $54,000 | $12,000 | $42,000 |
| 2021 | $1,910 | $54,000 | $12,000 | $42,000 |
| 2020 | $1,911 | $54,000 | $12,000 | $42,000 |
| 2019 | $2,104 | $54,000 | $12,000 | $42,000 |
| 2018 | $1,986 | $54,000 | $12,000 | $42,000 |
| 2017 | $1,797 | $54,000 | $12,000 | $42,000 |
| 2016 | $1,796 | $54,000 | $12,000 | $42,000 |
| 2015 | $1,653 | $54,000 | $12,000 | $42,000 |
| 2014 | $1,652 | $54,000 | $12,000 | $42,000 |
Source: Public Records
Map
Nearby Homes
- 120 Hilldale Ct
- 38 S Dickens Rd
- 14 Ruby Dr
- 610 S Walnutree Ln
- 139 Honeywell Dr
- 517 Darley Rd
- 742 W Birchtree Ln
- 1007 Stonewood Rd
- 43 Benning Rd
- 453 Lenape Way
- 1237 Parish Ave
- 50 Lawson Ave
- 52 Lawson Ave
- 1134 Clemson St
- 905 Harvey Rd
- 1390 Parish Ave
- 2 Franklin Ave
- 1602 Harvey Rd
- 3047 4th Ave
- 4 Lower Greenbriar Rd
Your Personal Tour Guide
Ask me questions while you tour the home.