
Landlord's Agent in 2024
Weimin Qian
Wayne Realty
(860) 460-9846
4 in this area
42 Total Sales
Estimated Value: $350,266 - $399,000
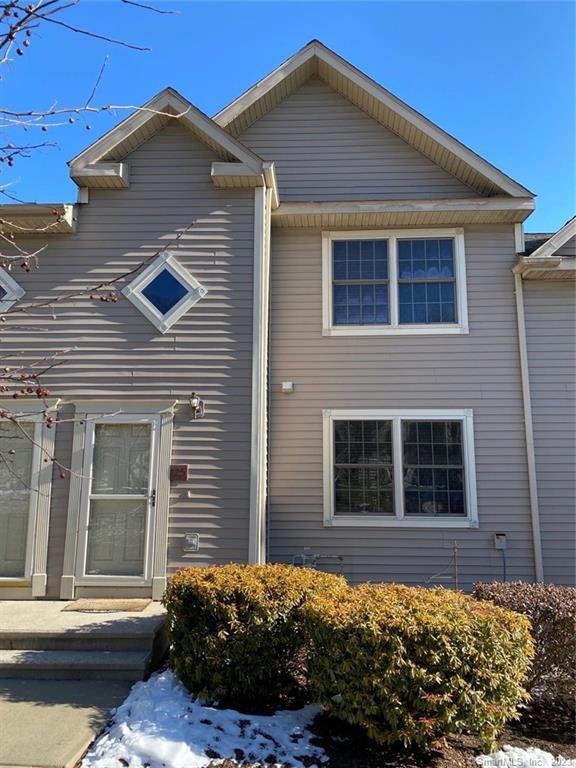
Well maintained, furnished with 2 bed and 2 full bath and 1 half bath. Each bedroom has its own private full bathroom. All hardwood floor and ceramic tiles. One car garage with garage door opener, Central AC. Laundry room in unit. An extra room at ground level could be used as an office/gym. Move-in condition. No pets, no smoking. Credit check. minimum FICO 700, Deposit.
Home Type
Est. Annual Taxes
Year Built
Home Design
Interior Spaces
Kitchen
Bedrooms and Bathrooms
Laundry
Parking
Outdoor Features
Schools
Utilities
Listing and Financial Details
Overview
Recreation
| Date | Buyer | Sale Price | Title Company |
|---|---|---|---|
| Wang Jian | $202,500 | -- | |
| Boyer Craig M | -- | -- | |
| Boyer Craig M | $289,900 | -- |
| Date | Status | Borrower | Loan Amount |
|---|---|---|---|
| Previous Owner | Boyer Craig M | $722,000 | |
| Previous Owner | Boyer Craig M | $202,903 |
| Date | Event | Price | Change | Sq Ft Price |
|---|---|---|---|---|
| 05/03/2024 05/03/24 | Rented | $2,000 | 0.0% | -- |
| 03/13/2024 03/13/24 | Under Contract | -- | -- | -- |
| 11/13/2023 11/13/23 | Price Changed | $2,000 | -13.0% | $1 / Sq Ft |
| 10/31/2023 10/31/23 | Price Changed | $2,300 | -8.0% | $2 / Sq Ft |
| 09/29/2023 09/29/23 | For Rent | $2,500 | +25.0% | -- |
| 03/29/2023 03/29/23 | Rented | $2,000 | 0.0% | -- |
| 03/04/2023 03/04/23 | Under Contract | -- | -- | -- |
| 01/17/2023 01/17/23 | For Rent | $2,000 | +25.0% | -- |
| 03/16/2020 03/16/20 | Rented | $1,600 | 0.0% | -- |
| 01/25/2020 01/25/20 | Off Market | $1,600 | -- | -- |
| 01/20/2020 01/20/20 | For Rent | $1,600 | 0.0% | -- |
| 01/18/2019 01/18/19 | Sold | $202,500 | -3.1% | $124 / Sq Ft |
| 11/11/2018 11/11/18 | For Sale | $209,000 | -- | $128 / Sq Ft |
| Year | Tax Paid | Tax Assessment Tax Assessment Total Assessment is a certain percentage of the fair market value that is determined by local assessors to be the total taxable value of land and additions on the property. | Land | Improvement |
|---|---|---|---|---|
| 2025 | $4,670 | $199,910 | $0 | $199,910 |
| 2024 | $4,458 | $199,910 | $0 | $199,910 |
| 2023 | $4,238 | $199,910 | $0 | $199,910 |
| 2022 | $4,200 | $152,380 | $0 | $152,380 |
| 2021 | $4,212 | $152,380 | $0 | $152,380 |
| 2020 | $4,247 | $152,380 | $0 | $152,380 |
| 2019 | $4,264 | $152,380 | $0 | $152,380 |
| 2018 | $4,178 | $152,380 | $0 | $152,380 |
| 2017 | $3,733 | $138,100 | $0 | $138,100 |
| 2016 | $3,698 | $138,100 | $0 | $138,100 |
| 2015 | $3,567 | $138,100 | $0 | $138,100 |
| 2014 | $3,567 | $138,100 | $0 | $138,100 |
Landlord's Agent in 2024
Weimin Qian
Wayne Realty
(860) 460-9846
4 in this area
42 Total Sales
Buyer's Agent in 2023
Nancy Newman
LPT Realty
(860) 681-8649
83 Total Sales
Seller's Agent in 2019
Minna Reid
Reid Real Estate Group
(203) 392-1023
27 Total Sales
Source: SmartMLS
MLS Number: 170601172
APN: WATE-000044-000000-007276
Disclaimer: Certain information contained herein is derived from information provided by parties other than Homes.com. All information provided is deemed reliable, but is not guaranteed to be accurate and should be independently verified.
![]() IDX information is provided exclusively for personal, non-commercial use, and may not be used for any purpose other than to identify prospective properties consumers may be interested in purchasing. Information is deemed reliable but not guaranteed.
IDX information is provided exclusively for personal, non-commercial use, and may not be used for any purpose other than to identify prospective properties consumers may be interested in purchasing. Information is deemed reliable but not guaranteed.