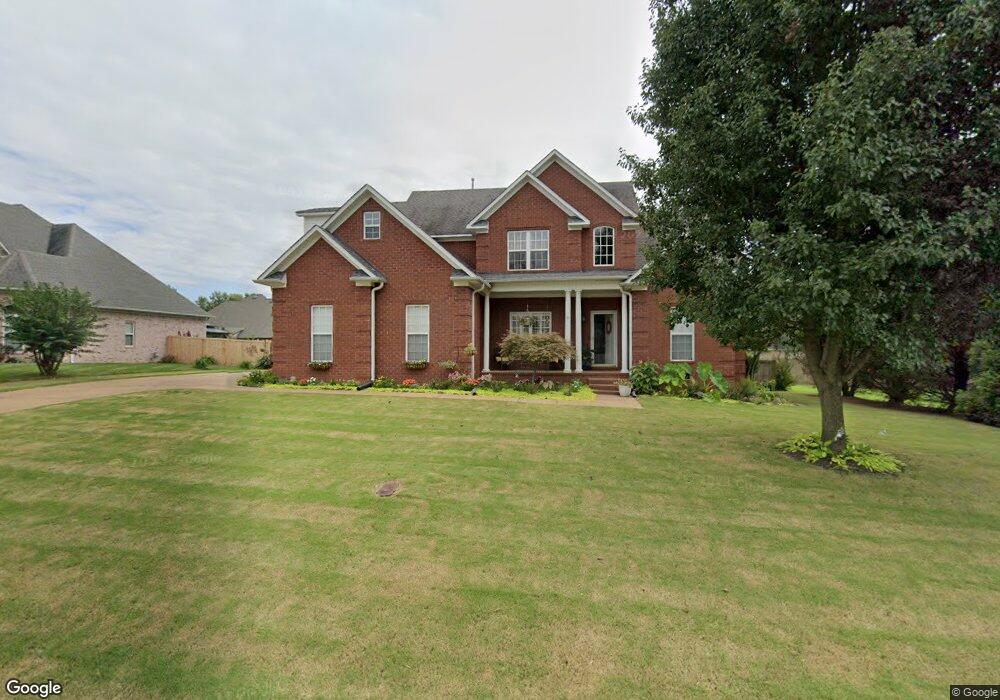
64 Wrights Mill Dr Jackson, TN 38305
Estimated Value: $368,266 - $459,000
3
Beds
3
Baths
2,450
Sq Ft
$172/Sq Ft
Est. Value
About This Home
This home is located at 64 Wrights Mill Dr, Jackson, TN 38305 and is currently estimated at $421,067, approximately $171 per square foot. 64 Wrights Mill Dr is a home located in Madison County with nearby schools including Pope School, Northeast Middle School, and North Side High School.
Ownership History
Date
Name
Owned For
Owner Type
Purchase Details
Closed on
Mar 9, 2026
Sold by
Campbell James
Bought by
Tanner Bradley and Tanner Cathy
Current Estimated Value
Home Financials for this Owner
Home Financials are based on the most recent Mortgage that was taken out on this home.
Original Mortgage
$212,430
Outstanding Balance
$212,430
Interest Rate
6.1%
Mortgage Type
New Conventional
Estimated Equity
$208,637
Purchase Details
Closed on
Sep 27, 2018
Sold by
Jordan Cathy C
Bought by
Campbell James E and Campbell Mona R
Purchase Details
Closed on
May 29, 2012
Sold by
Morrow William
Bought by
Jordan William J and Jordan Cathy C
Home Financials for this Owner
Home Financials are based on the most recent Mortgage that was taken out on this home.
Original Mortgage
$194,832
Interest Rate
3.87%
Mortgage Type
FHA
Purchase Details
Closed on
Jan 23, 2009
Sold by
Fitzhugh Clarence Eugene
Bought by
Morrow William
Purchase Details
Closed on
May 3, 2006
Sold by
Eugene Fitzhugh
Bought by
Eugene Fitzhugh Clarence
Home Financials for this Owner
Home Financials are based on the most recent Mortgage that was taken out on this home.
Original Mortgage
$192,900
Interest Rate
6.28%
Purchase Details
Closed on
Jun 24, 2004
Bought by
Fitzhugh Eugene
Purchase Details
Closed on
Feb 19, 2004
Bought by
Dtb Const Plumbing & Elc Co
Create a Home Valuation Report for This Property
The Home Valuation Report is an in-depth analysis detailing your home's value as well as a comparison with similar homes in the area
Purchase History
| Date | Buyer | Sale Price | Title Company |
|---|---|---|---|
| Tanner Bradley | $219,000 | None Listed On Document | |
| Campbell James E | $218,905 | None Available | |
| Jordan William J | $199,900 | -- | |
| Morrow William | $210,000 | -- | |
| Eugene Fitzhugh Clarence | -- | -- | |
| Fitzhugh Eugene | $191,000 | -- | |
| Dtb Const Plumbing & Elc Co | $29,000 | -- |
Source: Public Records
Mortgage History
| Date | Status | Borrower | Loan Amount |
|---|---|---|---|
| Open | Tanner Bradley | $212,430 | |
| Previous Owner | Jordan William J | $194,832 | |
| Previous Owner | Dtb Const Plumbing & Elc Co | $192,900 |
Source: Public Records
Tax History
| Year | Tax Paid | Tax Assessment Tax Assessment Total Assessment is a certain percentage of the fair market value that is determined by local assessors to be the total taxable value of land and additions on the property. | Land | Improvement |
|---|---|---|---|---|
| 2025 | $1,363 | $72,725 | $10,500 | $62,225 |
| 2024 | $1,363 | $72,725 | $10,500 | $62,225 |
| 2022 | $2,535 | $72,725 | $10,500 | $62,225 |
| 2021 | $2,116 | $49,075 | $9,000 | $40,075 |
| 2020 | $2,116 | $49,075 | $9,000 | $40,075 |
| 2019 | $2,116 | $49,075 | $9,000 | $40,075 |
| 2018 | $2,116 | $49,075 | $9,000 | $40,075 |
| 2017 | $2,021 | $45,800 | $8,250 | $37,550 |
| 2016 | $1,884 | $45,800 | $8,250 | $37,550 |
| 2015 | $1,883 | $45,800 | $8,250 | $37,550 |
| 2014 | $1,883 | $45,800 | $8,250 | $37,550 |
Source: Public Records
Map
Nearby Homes
- 80 Wrights Mill Dr
- 97 Wrights Mill Dr
- 23 Kinnewick Cove
- 52 Kinnewick Cove
- 19 Ravenwood Dr
- 135 Windy City Rd
- 116 Ravenwood Dr
- 00 Windy City Rd
- 52 Buckingham Cove
- 115 Buckingham Cove
- 72 Swanbourne Cove
- 79 Swanbourne Cove
- 127 Larkwood Dr
- 114 Larkwood Dr
- 9 Citrus Springs Cove
- 159 Larkwood Dr
- 107 Wyndchase Dr
- 59 Larkson Ln
- 54 Laurelwood Cove
- 60 Greendale Dr
- 72 Wrights Mill Dr
- 8 Flagstone Dr
- 16 Flagstone Dr
- 49 Rawlingwood Cove
- 52 Rawlingwood Cove
- 65 Wrights Mill Dr
- 57 Wrights Mill Dr
- 24 Flagstone Dr
- 73 Wrights Mill Dr
- 49 Wrights Mill Dr
- 41 Rawlingwood Cove
- 88 Wrights Mill Dr
- 81 Wrights Mill Dr
- 32 Flagstone Dr
- 46 Rawlingwood Cove
- 9 Flagstone Dr
- 17 Flagstone Dr
- 25 Flagstone Dr
- 89 Wrights Mill Dr
- 38 Rawlingwood Cove
Your Personal Tour Guide
Ask me questions while you tour the home.