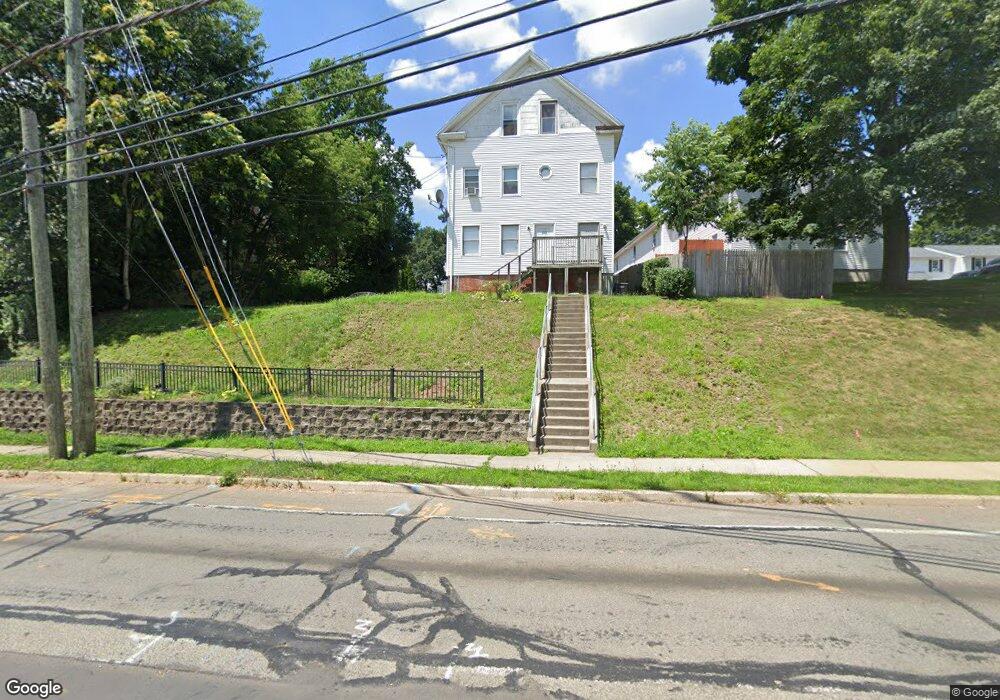
640 N Colony St Meriden, CT 06450
Estimated Value: $293,146 - $404,000
5
Beds
3
Baths
3,193
Sq Ft
$111/Sq Ft
Est. Value
About This Home
This home is located at 640 N Colony St, Meriden, CT 06450 and is currently estimated at $355,287, approximately $111 per square foot. 640 N Colony St is a home located in New Haven County with nearby schools including John Barry School, Francis T. Maloney High School, and Chase Collegiate School.
Ownership History
Date
Name
Owned For
Owner Type
Purchase Details
Closed on
Dec 7, 2015
Sold by
Lcm Group Llc
Bought by
Ayala Luis and Lorenzo Marilyn
Current Estimated Value
Home Financials for this Owner
Home Financials are based on the most recent Mortgage that was taken out on this home.
Original Mortgage
$315,000
Outstanding Balance
$282,488
Interest Rate
8.99%
Mortgage Type
New Conventional
Estimated Equity
$72,799
Purchase Details
Closed on
Mar 16, 2012
Sold by
Lmc Group Llc
Bought by
Lmc Group Llc
Purchase Details
Closed on
Mar 8, 2011
Sold by
Birmingham Invest Llc
Bought by
Lcm Group Llc
Purchase Details
Closed on
Aug 5, 2008
Sold by
Lcm Group Llc
Bought by
Birmingham Investment
Home Financials for this Owner
Home Financials are based on the most recent Mortgage that was taken out on this home.
Original Mortgage
$184,000
Interest Rate
8%
Mortgage Type
Purchase Money Mortgage
Purchase Details
Closed on
Feb 21, 2001
Sold by
Ocwen Fed Bank Fsb
Bought by
Karb Harold R
Purchase Details
Closed on
Dec 15, 1997
Sold by
Wilshire Credit Corp
Bought by
Zarabozo Humberto
Create a Home Valuation Report for This Property
The Home Valuation Report is an in-depth analysis detailing your home's value as well as a comparison with similar homes in the area
Home Values in the Area
Average Home Value in this Area
Purchase History
| Date | Buyer | Sale Price | Title Company |
|---|---|---|---|
| Ayala Luis | $150,000 | -- | |
| Ayala Luis | $150,000 | -- | |
| Lmc Group Llc | -- | -- | |
| Lcm Group Llc | -- | -- | |
| Birmingham Investment | $150,000 | -- | |
| Karb Harold R | $8,500 | -- | |
| Zarabozo Humberto | $8,000 | -- |
Source: Public Records
Mortgage History
| Date | Status | Borrower | Loan Amount |
|---|---|---|---|
| Open | Zarabozo Humberto | $315,000 | |
| Previous Owner | Zarabozo Humberto | $184,000 | |
| Previous Owner | Zarabozo Humberto | $57,000 |
Source: Public Records
Tax History Compared to Growth
Tax History
| Year | Tax Paid | Tax Assessment Tax Assessment Total Assessment is a certain percentage of the fair market value that is determined by local assessors to be the total taxable value of land and additions on the property. | Land | Improvement |
|---|---|---|---|---|
| 2025 | $5,281 | $139,300 | $27,930 | $111,370 |
| 2024 | $5,364 | $139,300 | $27,930 | $111,370 |
| 2023 | $5,171 | $139,300 | $27,930 | $111,370 |
| 2022 | $4,878 | $139,300 | $27,930 | $111,370 |
| 2021 | $4,263 | $97,930 | $28,280 | $69,650 |
| 2020 | $4,251 | $97,930 | $28,280 | $69,650 |
| 2019 | $4,215 | $97,930 | $28,280 | $69,650 |
| 2018 | $4,232 | $97,930 | $28,280 | $69,650 |
| 2017 | $4,119 | $97,930 | $28,280 | $69,650 |
| 2016 | $3,808 | $98,000 | $26,950 | $71,050 |
| 2015 | $3,808 | $98,210 | $27,160 | $71,050 |
| 2014 | $3,715 | $98,210 | $27,160 | $71,050 |
Source: Public Records
Map
Nearby Homes
- 51 Griswold St
- 181 Hicks St Unit 2C
- 30 Tremont St
- 618 Blackstone Village
- 52 Webster St
- 149 Woodland St
- 23 Howe St
- 33 Prescott St
- 35 Morse St
- 396 Gracey Ave
- 19 Blackstone St
- 22 Webster St
- 53 Woodland St
- 387 Colony St
- 334 Gracey Ave
- 929 N Colony Rd Unit 6
- 419 Gracey Ave
- 64 Fair St
- 9 Milton Dr
- 465 Pratt Street Extension
- 660 N Colony Rd Unit 8
- 660 N Colony St Unit 9
- 660 N Colony St Unit 8
- 660 N Colony St Unit 7
- 660 N Colony St Unit 6
- 660 N Colony St Unit 5
- 660 N Colony St Unit 4
- 660 N Colony St Unit 3
- 660 N Colony St Unit 2
- 660 N Colony St Unit 14
- 660 N Colony St Unit 13
- 660 N Colony St Unit 12
- 660 N Colony St Unit 11
- 660 N Colony St Unit 10
- 660 N Colony St Unit 1
- 660 N Colony St
- 623 N Colony St
- 621 N Colony St
- 604 N Colony St
- 619 N Colony St