Estimated Value: $381,000 - $385,035
4
Beds
3
Baths
3,024
Sq Ft
$127/Sq Ft
Est. Value
About This Home
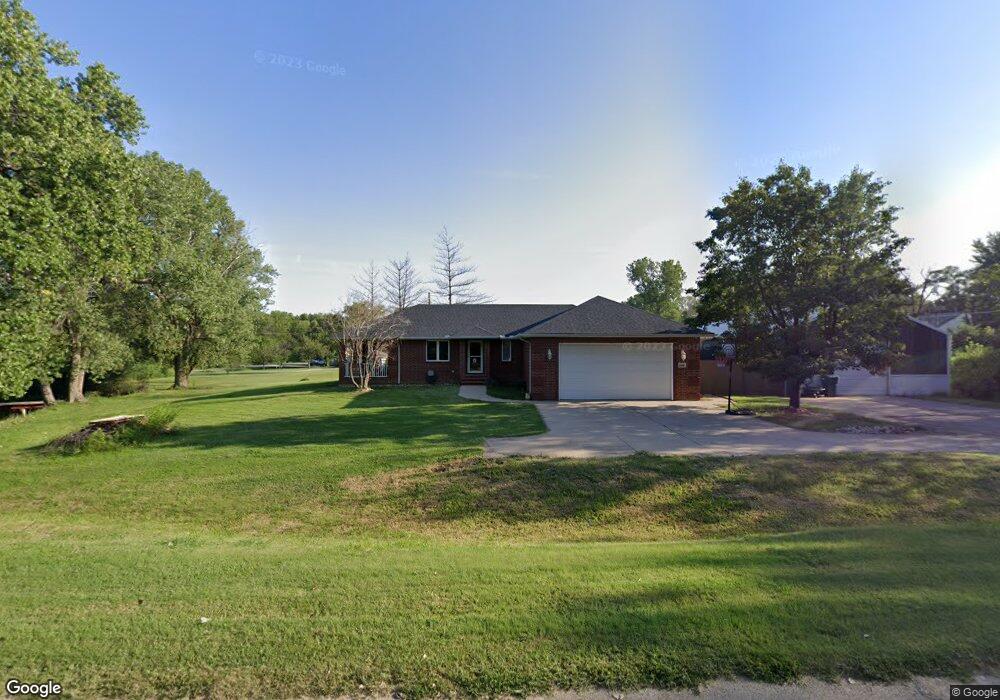
This home is located at 6400 E 49th St S, Derby, KS 67037 and is currently estimated at $383,018, approximately $126 per square foot. 6400 E 49th St S is a home located in Sedgwick County with nearby schools including Oaklawn Elementary School, Derby High School, and St Mary Parish Catholic School.
Ownership History
Date
Name
Owned For
Owner Type
Purchase Details
Closed on
Apr 28, 2021
Sold by
Willis Brown Benja L and Willis Brown Pamela
Bought by
Mcginty Maurer Courtney and Mcginty Maurer Jessica
Current Estimated Value
Home Financials for this Owner
Home Financials are based on the most recent Mortgage that was taken out on this home.
Original Mortgage
$326,340
Outstanding Balance
$295,283
Interest Rate
3%
Mortgage Type
VA
Estimated Equity
$87,735
Purchase Details
Closed on
Mar 2, 2012
Sold by
Brown Benja L
Bought by
Willis Brown Benja L
Purchase Details
Closed on
Apr 14, 2010
Sold by
Brown Benja L and Fryer Jody
Bought by
Brown Benja L
Home Financials for this Owner
Home Financials are based on the most recent Mortgage that was taken out on this home.
Original Mortgage
$218,000
Interest Rate
4.9%
Mortgage Type
New Conventional
Purchase Details
Closed on
Jun 9, 1999
Sold by
Collins Gregory T and Collins Pamela J
Bought by
Logue Elmer S
Create a Home Valuation Report for This Property
The Home Valuation Report is an in-depth analysis detailing your home's value as well as a comparison with similar homes in the area
Home Values in the Area
Average Home Value in this Area
Purchase History
| Date | Buyer | Sale Price | Title Company |
|---|---|---|---|
| Mcginty Maurer Courtney | -- | Security 1St Title Llc | |
| Willis Brown Benja L | -- | None Available | |
| Brown Benja L | -- | Security 1St Title | |
| Logue Elmer S | -- | -- |
Source: Public Records
Mortgage History
| Date | Status | Borrower | Loan Amount |
|---|---|---|---|
| Open | Mcginty Maurer Courtney | $326,340 | |
| Previous Owner | Brown Benja L | $218,000 |
Source: Public Records
Tax History Compared to Growth
Tax History
| Year | Tax Paid | Tax Assessment Tax Assessment Total Assessment is a certain percentage of the fair market value that is determined by local assessors to be the total taxable value of land and additions on the property. | Land | Improvement |
|---|---|---|---|---|
| 2025 | $5,244 | $42,999 | $2,841 | $40,158 |
| 2023 | $5,244 | $40,044 | $2,404 | $37,640 |
| 2022 | $4,150 | $34,868 | $2,277 | $32,591 |
| 2021 | $4,246 | $35,651 | $1,932 | $33,719 |
| 2020 | $4,072 | $34,236 | $1,932 | $32,304 |
| 2019 | $3,830 | $32,163 | $1,955 | $30,208 |
| 2018 | $3,614 | $30,350 | $1,208 | $29,142 |
| 2017 | $3,062 | $0 | $0 | $0 |
| 2016 | $2,941 | $0 | $0 | $0 |
| 2015 | $2,921 | $0 | $0 | $0 |
| 2014 | $2,776 | $0 | $0 | $0 |
Source: Public Records
Map
Nearby Homes
- 6630 E 51st St S
- 148 E Ripley Ct
- 801 E Bellows
- 378 Cedar Ranch St
- 836 E Freedom St
- 00000-1b E 44th St S
- 00000-1a E 44th St S
- 10 E 44th St S
- 9 E 44th St S
- 7200 E 47th St S
- 3312 N Emerson St
- 4530 S Land Ave
- 14611 E 60th St S
- 3006 N Rock Bridge St
- 2918 N Emerson St
- 206 E Fieldstone Ct
- 430 E Wild Plum Rd
- 4510 S Clifton Ave
- 4626 S Hemlock Ave
- 9500 E Cherish Rd
- 4940 S Woodlawn Blvd
- 4937 S Mission St
- 4922 S Woodlawn Blvd
- 4921 S Mission St
- 5022 S Woodlawn Blvd
- 4949 S Woodlawn Blvd
- 4944 S Mission St
- 4906 S Woodlawn Blvd
- 4905 S Mission St
- 6511 E 49th St S
- 5050 S Woodlawn Blvd
- 6629 E Edyth Dr
- 5042 S Woodlawn Blvd
- 4845 S Mission St
- 6600 E Edyth Dr
- 5100 S Woodlawn Blvd
- 6701 E Edyth Dr
- 6801 E Edyth Dr
- 6601 E Edyth Dr
- 6501 E Edyth Dr