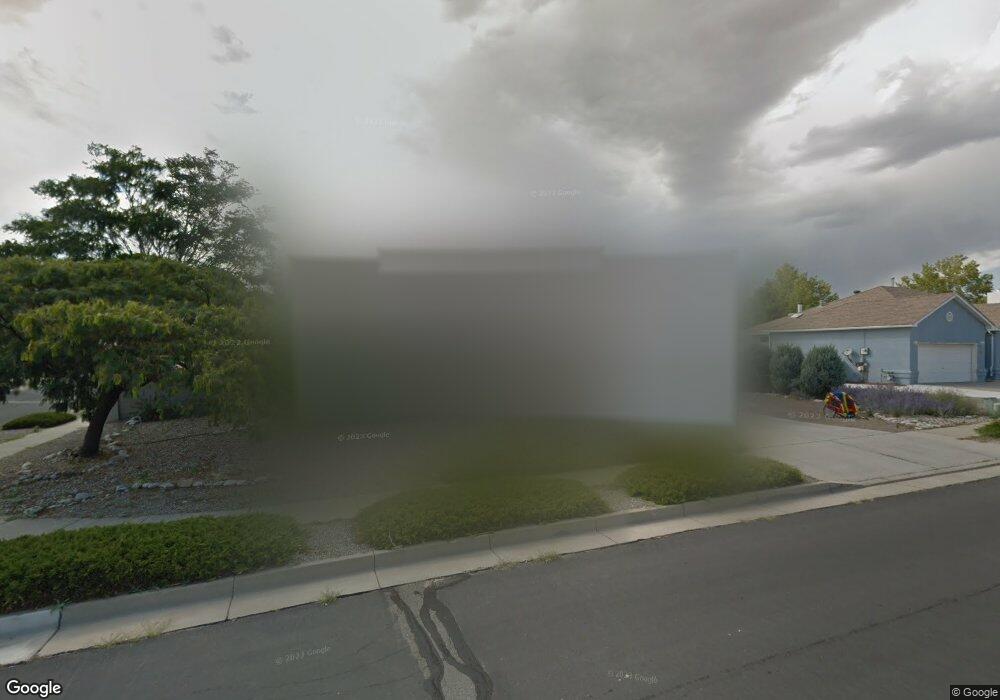
6403 Thunderbird Cir NW Albuquerque, NM 87120
Taylor Ranch NeighborhoodEstimated Value: $481,000 - $576,000
4
Beds
3
Baths
2,644
Sq Ft
$201/Sq Ft
Est. Value
About This Home
This home is located at 6403 Thunderbird Cir NW, Albuquerque, NM 87120 and is currently estimated at $532,493, approximately $201 per square foot. 6403 Thunderbird Cir NW is a home located in Bernalillo County with nearby schools including Marie M. Hughes Elementary School, L.B. Johnson Middle School, and Volcano Vista High School.
Ownership History
Date
Name
Owned For
Owner Type
Purchase Details
Closed on
Sep 26, 2022
Sold by
Rankin Eric
Bought by
Rankin Eric L and Gipson-Rankin Sonia Maria
Current Estimated Value
Home Financials for this Owner
Home Financials are based on the most recent Mortgage that was taken out on this home.
Original Mortgage
$241,300
Outstanding Balance
$227,634
Interest Rate
4%
Mortgage Type
New Conventional
Estimated Equity
$304,859
Purchase Details
Closed on
Apr 4, 2003
Sold by
Marcum Kelly E and Marcum Jolynn
Bought by
Rankin Eric
Home Financials for this Owner
Home Financials are based on the most recent Mortgage that was taken out on this home.
Original Mortgage
$183,800
Interest Rate
5.77%
Purchase Details
Closed on
Sep 30, 1999
Sold by
Arndorfer Ken and Arndorfer Bobbi
Bought by
Marcum Kelly E and Marcum Jolynn
Home Financials for this Owner
Home Financials are based on the most recent Mortgage that was taken out on this home.
Original Mortgage
$170,000
Interest Rate
8.02%
Create a Home Valuation Report for This Property
The Home Valuation Report is an in-depth analysis detailing your home's value as well as a comparison with similar homes in the area
Home Values in the Area
Average Home Value in this Area
Purchase History
| Date | Buyer | Sale Price | Title Company |
|---|---|---|---|
| Rankin Eric L | -- | -- | |
| Rankin Eric | -- | Rio Rancho Title Inc | |
| Marcum Kelly E | -- | Fidelity National Title Ins |
Source: Public Records
Mortgage History
| Date | Status | Borrower | Loan Amount |
|---|---|---|---|
| Open | Rankin Eric L | $241,300 | |
| Previous Owner | Rankin Eric | $183,800 | |
| Previous Owner | Marcum Kelly E | $170,000 | |
| Closed | Rankin Eric | $45,950 |
Source: Public Records
Tax History Compared to Growth
Tax History
| Year | Tax Paid | Tax Assessment Tax Assessment Total Assessment is a certain percentage of the fair market value that is determined by local assessors to be the total taxable value of land and additions on the property. | Land | Improvement |
|---|---|---|---|---|
| 2025 | $4,229 | $105,289 | $28,360 | $76,929 |
| 2024 | $4,229 | $102,223 | $27,535 | $74,688 |
| 2023 | $4,156 | $99,246 | $26,733 | $72,513 |
| 2022 | $4,013 | $96,355 | $25,954 | $70,401 |
| 2021 | $3,876 | $93,549 | $25,198 | $68,351 |
| 2020 | $3,810 | $90,824 | $24,464 | $66,360 |
| 2019 | $3,839 | $91,524 | $24,464 | $67,060 |
| 2018 | $3,725 | $91,524 | $24,464 | $67,060 |
| 2017 | $3,608 | $89,449 | $26,733 | $62,716 |
| 2016 | $3,502 | $84,314 | $25,198 | $59,116 |
| 2015 | $81,858 | $81,858 | $24,464 | $57,394 |
| 2014 | $3,391 | $81,858 | $24,464 | $57,394 |
| 2013 | -- | $82,458 | $24,464 | $57,994 |
Source: Public Records
Map
Nearby Homes
- 6420 Pojoaque Rd NW
- 6616 Meadow Lake Place NW
- 6101 Chimayo Dr NW
- 6116 Agate Ave NW
- 5901 Chimayo Dr NW
- 5805 Chimayo Dr NW
- 6133 Flor de Mayo Place NW
- 5305 Desert Sand Place NW
- 6005 Rio Pueblo Dr NW
- 6012 Open Sky Dr NW
- 6020 Jamers Place NW
- 5429 Gold Rush Dr NW
- 5404 Territorial Rd NW
- 0 Santo Domingo St NW Unit 1072927
- 5504 Hayes Dr NW
- 5609 Cambria Rd NW
- 7300 Target Ln NW
- 8213 Urraca St NW
- 6304 Flor Del Sol Place NW
- 5432 Mariposa Dr NW
- 6407 Thunderbird Cir NW
- 6105 Carousal Ave NW
- 6100 Carousal Ave NW
- 6104 Carousal Ave NW
- 6104 Carousal Ave NW Unit AVE
- 6400 Thunderbird Cir NW
- 6109 Carousal Ave NW
- 6404 Thunderbird Cir NW
- 6411 Thunderbird Cir NW
- 6112 Thunderbird Cir NW
- 6108 Carousal Ave NW
- 6008 Carousal Ave NW
- 6408 Thunderbird Cir NW
- 6116 Thunderbird Cir NW
- 6117 Carousal Ave NW
- 6112 Carousal Ave NW
- 6019 Kachina St NW
- 6412 Thunderbird Cir NW
- 6004 Carousal Ave NW
- 6015 Kachina St NW