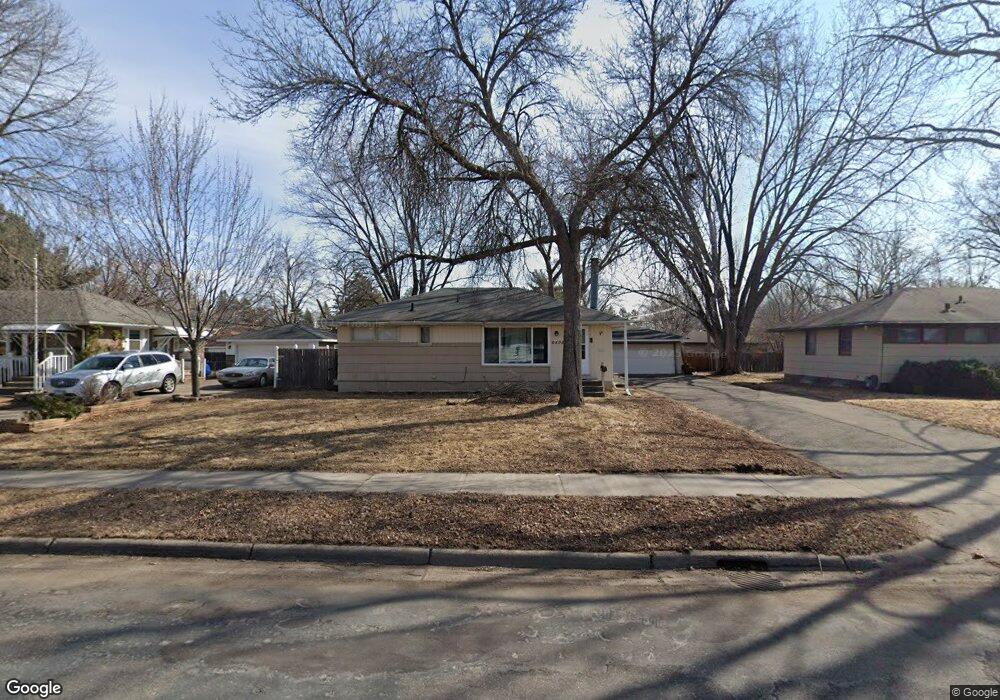
6406 Unity Ave N Minneapolis, MN 55429
Orchard Lake NeighborhoodEstimated Value: $302,000 - $323,000
3
Beds
2
Baths
966
Sq Ft
$320/Sq Ft
Est. Value
About This Home
This home is located at 6406 Unity Ave N, Minneapolis, MN 55429 and is currently estimated at $309,231, approximately $320 per square foot. 6406 Unity Ave N is a home located in Hennepin County with nearby schools including Fair Oaks Elementary School, Maple Grove Middle School, and Park Center Senior High.
Ownership History
Date
Name
Owned For
Owner Type
Purchase Details
Closed on
Dec 28, 2018
Sold by
Hedlund Amber and Hedlund Mark
Bought by
Hietala Jeffrey
Current Estimated Value
Home Financials for this Owner
Home Financials are based on the most recent Mortgage that was taken out on this home.
Original Mortgage
$8,000
Interest Rate
4.8%
Mortgage Type
New Conventional
Purchase Details
Closed on
Sep 9, 2008
Sold by
Amethyst Enterprises Inc
Bought by
Hedlund Mark and Kehoe Amber
Purchase Details
Closed on
Aug 16, 2005
Sold by
Wittmer Diane M and Cole Sammie
Bought by
Cole Michael D and Cole Melissa M
Purchase Details
Closed on
May 30, 2002
Sold by
Gage Robert F and Gage Sharon M
Bought by
Cole Sammie and Wittmer Diane M
Create a Home Valuation Report for This Property
The Home Valuation Report is an in-depth analysis detailing your home's value as well as a comparison with similar homes in the area
Home Values in the Area
Average Home Value in this Area
Purchase History
| Date | Buyer | Sale Price | Title Company |
|---|---|---|---|
| Hietala Jeffrey | $212,500 | Executive Title | |
| Hedlund Mark | $154,500 | -- | |
| Cole Michael D | $204,000 | -- | |
| Cole Sammie | $168,500 | -- |
Source: Public Records
Mortgage History
| Date | Status | Borrower | Loan Amount |
|---|---|---|---|
| Closed | Hietala Jeffrey | $8,000 | |
| Open | Hietala Jeffrey | $208,650 |
Source: Public Records
Tax History
| Year | Tax Paid | Tax Assessment Tax Assessment Total Assessment is a certain percentage of the fair market value that is determined by local assessors to be the total taxable value of land and additions on the property. | Land | Improvement |
|---|---|---|---|---|
| 2024 | $3,914 | $271,300 | $88,000 | $183,300 |
| 2023 | $3,946 | $276,400 | $92,000 | $184,400 |
| 2022 | $3,243 | $266,000 | $88,000 | $178,000 |
| 2021 | $3,079 | $234,000 | $77,000 | $157,000 |
| 2020 | $3,142 | $210,000 | $61,000 | $149,000 |
| 2019 | $2,872 | $192,000 | $55,000 | $137,000 |
| 2018 | $2,528 | $182,000 | $52,000 | $130,000 |
| 2017 | $2,413 | $154,000 | $41,000 | $113,000 |
| 2016 | $2,510 | $157,100 | $44,500 | $112,600 |
| 2015 | $2,228 | $141,500 | $39,500 | $102,000 |
| 2014 | -- | $116,400 | $34,400 | $82,000 |
Source: Public Records
Map
Nearby Homes
- 6313 Vera Cruz Ln N
- 5107 Winchester Ln
- 6430 Perry Ave N
- 6330 Perry Ave N
- 6318 Perry Ave N
- 6706 Toledo Ave N
- 6000 64th Ave N
- 6801 Toledo Ave N
- 6116 64th Ave N
- 6236 Major Ave N
- 6456 Edgewood Ave N
- 6909 Unity Ave N
- 6318 Kyle Ave N
- 5924 Regent Ave N
- 6017 Bethia Ln
- 7018 Quail Ave N
- 5916 Quail Ave N
- 4710 58th Ave N Unit 303
- 4710 58th Ave N Unit 221
- 4710 58th Ave N Unit 202
- 6400 Unity Ave N
- 6412 Unity Ave N
- 6412 Unity Ave N
- 6406 6406 Unity-Avenue-n
- 6400 6400 Unity-Avenue-
- 6413 Toledo Ave N
- 6413 Toledo Ave N
- 6419 Toledo Ave N
- 6342 Unity Ave N
- 6418 Unity Ave N
- 6407 Toledo Ave N
- 6407 Unity Ave N
- 6419 6419 Unity Ave N
- 6413 Unity Ave N
- 6425 Toledo Ave N
- 6401 Unity Ave N
- 6424 Unity Ave N
- 6336 Unity Ave N
- 6419 Unity Ave N
- 6401 Toledo Ave N
Your Personal Tour Guide
Ask me questions while you tour the home.