Estimated Value: $928,062 - $1,117,000
3
Beds
3
Baths
2,550
Sq Ft
$415/Sq Ft
Est. Value
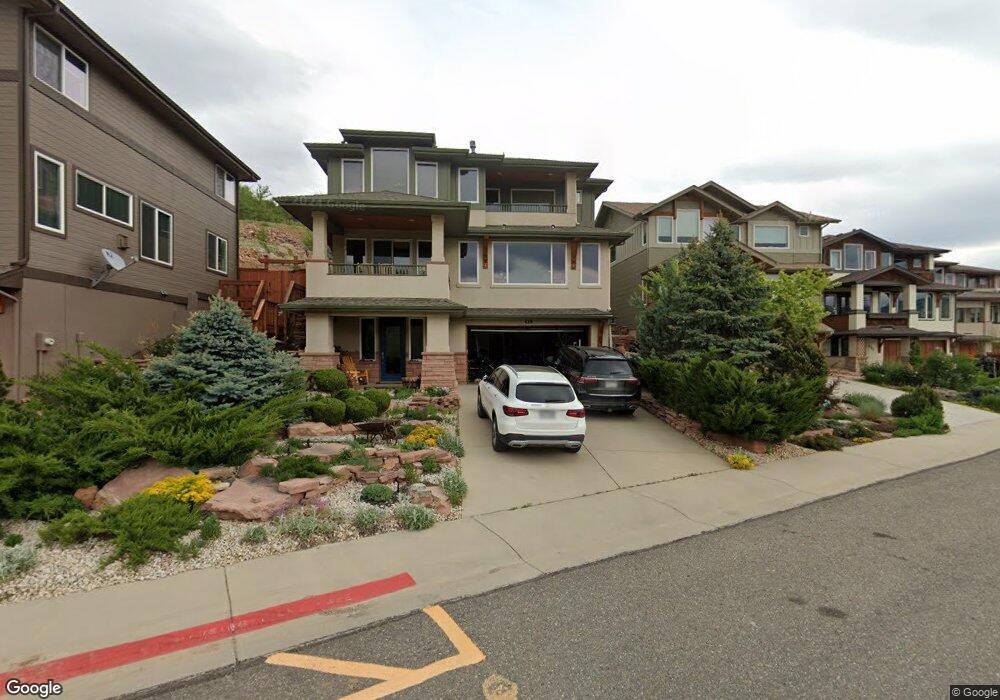
About This Home
This home is located at 641 1st Ave, Lyons, CO 80540 and is currently estimated at $1,057,266, approximately $414 per square foot. 641 1st Ave is a home located in Boulder County with nearby schools including Lyons Elementary School and Lyons Middle/Senior High School.
Ownership History
Date
Name
Owned For
Owner Type
Purchase Details
Closed on
Aug 13, 2002
Sold by
Pr Homes Inc
Bought by
Paterno Robert J
Current Estimated Value
Home Financials for this Owner
Home Financials are based on the most recent Mortgage that was taken out on this home.
Original Mortgage
$368,000
Outstanding Balance
$156,276
Interest Rate
6.6%
Estimated Equity
$900,990
Purchase Details
Closed on
Jan 23, 2002
Sold by
Calcagno Paul T and Benson Richard P
Bought by
Pr Homes Inc
Home Financials for this Owner
Home Financials are based on the most recent Mortgage that was taken out on this home.
Original Mortgage
$322,000
Interest Rate
7.07%
Purchase Details
Closed on
Oct 30, 2001
Sold by
Mason Scott H
Bought by
Calcagno Paul T and Benson Richard P
Home Financials for this Owner
Home Financials are based on the most recent Mortgage that was taken out on this home.
Original Mortgage
$61,500
Interest Rate
6.77%
Create a Home Valuation Report for This Property
The Home Valuation Report is an in-depth analysis detailing your home's value as well as a comparison with similar homes in the area
Purchase History
| Date | Buyer | Sale Price | Title Company |
|---|---|---|---|
| Paterno Robert J | $460,000 | First Colorado Title | |
| Pr Homes Inc | -- | -- | |
| Calcagno Paul T | $82,000 | -- |
Source: Public Records
Mortgage History
| Date | Status | Borrower | Loan Amount |
|---|---|---|---|
| Open | Paterno Robert J | $368,000 | |
| Previous Owner | Pr Homes Inc | $322,000 | |
| Previous Owner | Calcagno Paul T | $61,500 |
Source: Public Records
Tax History
| Year | Tax Paid | Tax Assessment Tax Assessment Total Assessment is a certain percentage of the fair market value that is determined by local assessors to be the total taxable value of land and additions on the property. | Land | Improvement |
|---|---|---|---|---|
| 2025 | $7,131 | $69,969 | $3,900 | $66,069 |
| 2024 | $7,131 | $69,969 | $3,900 | $66,069 |
| 2023 | $7,035 | $59,965 | $3,625 | $60,025 |
| 2022 | $6,971 | $56,545 | $3,315 | $53,230 |
| 2021 | $6,887 | $58,173 | $3,411 | $54,762 |
| 2020 | $6,047 | $50,608 | $8,652 | $41,956 |
| 2019 | $5,927 | $50,608 | $8,652 | $41,956 |
| 2018 | $5,214 | $45,410 | $8,712 | $36,698 |
| 2017 | $5,128 | $50,204 | $9,632 | $40,572 |
| 2016 | $5,125 | $44,186 | $8,676 | $35,510 |
| 2015 | $4,873 | $38,279 | $5,731 | $32,548 |
| 2014 | $3,968 | $38,279 | $5,731 | $32,548 |
Source: Public Records
Map
Nearby Homes
- 618 Overlook Dr
- 342 4th Ave
- 125 Longs Peak Dr
- 18673 Route 7
- 1040 5th Ave 2 and 4
- 1040 5th Ave 5
- 121 Osprey Ln
- 350 Mcconnell Dr
- 1117 5th Ave
- 1117 N 5th Ave
- 104 Noland Ct
- 223 Stone Canyon Rd
- 0 Apple Valley Rd
- 430 Carter Dr
- 2615 Eagle Ridge Rd
- 119 Eagle Canyon Cir
- 2685 Eagle Ridge Rd
- 1285 Eagle Ridge Rd
- 1669 Apple Valley Rd
- 101 Lewis Ln
Your Personal Tour Guide
Ask me questions while you tour the home.