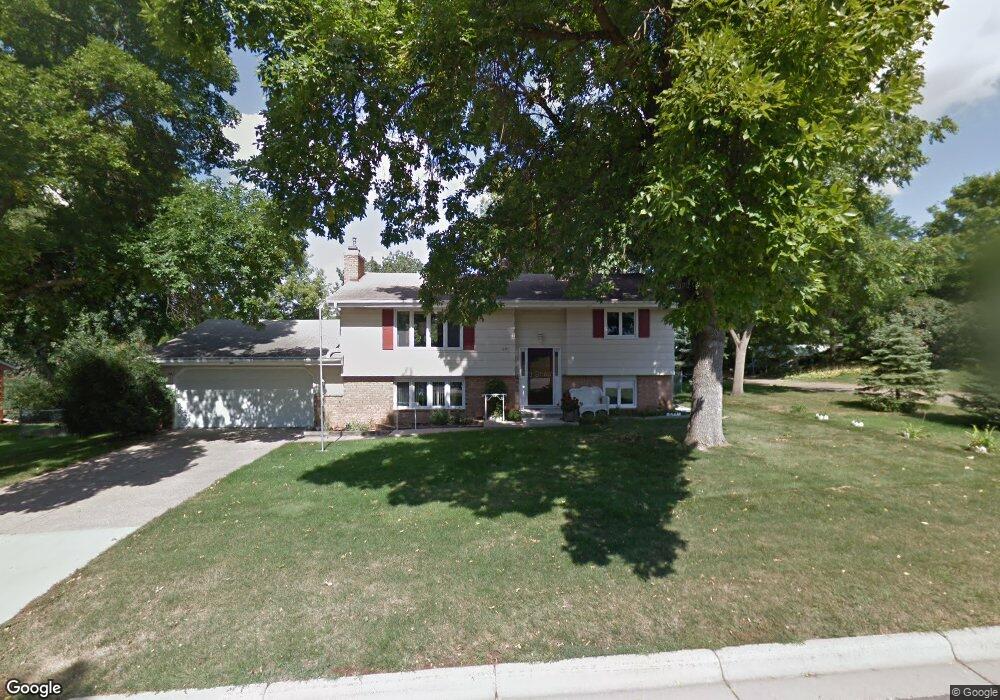
641 3rd Ave Saint Paul, MN 55118
Estimated Value: $444,859 - $525,000
4
Beds
2
Baths
2,133
Sq Ft
$227/Sq Ft
Est. Value
About This Home
This home is located at 641 3rd Ave, Saint Paul, MN 55118 and is currently estimated at $484,465, approximately $227 per square foot. 641 3rd Ave is a home located in Dakota County with nearby schools including Somerset Elementary School, Heritage E-STEM Magnet School, and Two Rivers High School.
Ownership History
Date
Name
Owned For
Owner Type
Purchase Details
Closed on
Sep 15, 2020
Sold by
Monson Brandon Brandon
Bought by
Nichols Connor Connor
Current Estimated Value
Home Financials for this Owner
Home Financials are based on the most recent Mortgage that was taken out on this home.
Interest Rate
2.86%
Purchase Details
Closed on
Jun 27, 2018
Sold by
Manion Kathryn J and Moor Brent
Bought by
Monson Brandon Cory and Belmore Danielle Eileen
Home Financials for this Owner
Home Financials are based on the most recent Mortgage that was taken out on this home.
Original Mortgage
$308,000
Interest Rate
4.5%
Mortgage Type
New Conventional
Purchase Details
Closed on
Feb 26, 2018
Sold by
Christensen Rosalie Juntunen
Bought by
Manion Kathryn J
Purchase Details
Closed on
Jun 23, 2015
Sold by
Christensen Curtis A and Christensen Rosalie Juntenen
Bought by
Juntunen Rosalie Juntunen
Create a Home Valuation Report for This Property
The Home Valuation Report is an in-depth analysis detailing your home's value as well as a comparison with similar homes in the area
Home Values in the Area
Average Home Value in this Area
Purchase History
| Date | Buyer | Sale Price | Title Company |
|---|---|---|---|
| Nichols Connor Connor | $407,500 | -- | |
| Monson Brandon Cory | $385,000 | Partners Title Llc | |
| Manion Kathryn J | $315,000 | Partners Title Llc | |
| Juntunen Rosalie Juntunen | -- | None Available |
Source: Public Records
Mortgage History
| Date | Status | Borrower | Loan Amount |
|---|---|---|---|
| Closed | Nichols Connor Connor | -- | |
| Previous Owner | Monson Brandon Cory | $308,000 |
Source: Public Records
Tax History
| Year | Tax Paid | Tax Assessment Tax Assessment Total Assessment is a certain percentage of the fair market value that is determined by local assessors to be the total taxable value of land and additions on the property. | Land | Improvement |
|---|---|---|---|---|
| 2024 | $4,246 | $421,900 | $118,600 | $303,300 |
| 2023 | $4,228 | $408,800 | $115,900 | $292,900 |
| 2022 | $3,702 | $386,400 | $115,600 | $270,800 |
| 2021 | $3,208 | $326,000 | $100,500 | $225,500 |
| 2020 | $3,354 | $323,400 | $95,800 | $227,600 |
| 2019 | $3,232 | $325,600 | $89,400 | $236,200 |
| 2018 | $2,961 | $300,300 | $83,600 | $216,700 |
| 2017 | $3,386 | $287,000 | $79,600 | $207,400 |
| 2016 | $3,221 | $274,900 | $75,800 | $199,100 |
| 2015 | $3,098 | $247,904 | $71,832 | $176,072 |
| 2014 | -- | $225,995 | $66,909 | $159,086 |
| 2013 | -- | $219,346 | $64,667 | $154,679 |
Source: Public Records
Map
Nearby Homes
- 130x Dodd Rd
- 1280 Dodd Rd
- 625 Ivy Falls Ave
- 622 Maple Park Dr
- 480 Emerson Ave W
- 685 Hidden Creek Trail
- 8 Dorset Rd
- 426 Emerson Ave W
- 1248 Delaware Ave
- 396 Thompson Ave W
- 1356 Riverside Ln
- 679 Marie Ave W
- 631 Callahan Place
- 1072 Delaware Ave
- 641 Sibley Memorial Hwy
- 1885 Heather Ct
- 1871 Chardel Ct
- TBD Barbara Ct
- 69 Langer Cir
- 1912 South Ln
Your Personal Tour Guide
Ask me questions while you tour the home.