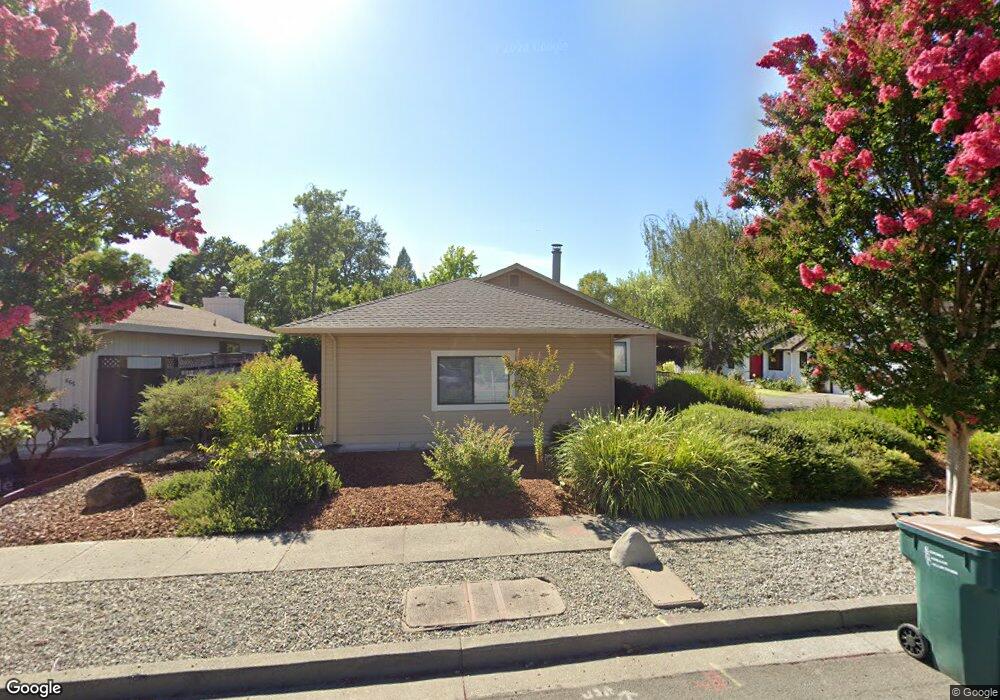
641 4th St E Sonoma, CA 95476
Estimated Value: $1,218,000 - $1,384,000
3
Beds
2
Baths
1,436
Sq Ft
$894/Sq Ft
Est. Value
About This Home
This home is located at 641 4th St E, Sonoma, CA 95476 and is currently estimated at $1,283,354, approximately $893 per square foot. 641 4th St E is a home located in Sonoma County with nearby schools including Prestwood Elementary School, Adele Harrison Middle School, and Creekside High School.
Ownership History
Date
Name
Owned For
Owner Type
Purchase Details
Closed on
Jan 25, 2021
Sold by
Liu Curtis and Tang Linda Yu
Bought by
Liu Curtis and Tang Linda Yu
Current Estimated Value
Purchase Details
Closed on
Apr 2, 2015
Sold by
Alich Susan Jane and Moras Family Trust
Bought by
Liu Curtis and Tang Linda Yu
Purchase Details
Closed on
Jul 28, 1997
Sold by
Moras Barbara Jane
Bought by
Moras Henry
Purchase Details
Closed on
Jul 17, 1997
Sold by
Moras Henry
Bought by
Moras Henry and The Moras Family Trust
Purchase Details
Closed on
Jul 31, 1995
Sold by
Kunzman Richard A and Kunzman Nancy L
Bought by
Moras Henry and Moras Barbara Jane
Home Financials for this Owner
Home Financials are based on the most recent Mortgage that was taken out on this home.
Original Mortgage
$130,000
Interest Rate
7.61%
Create a Home Valuation Report for This Property
The Home Valuation Report is an in-depth analysis detailing your home's value as well as a comparison with similar homes in the area
Home Values in the Area
Average Home Value in this Area
Purchase History
| Date | Buyer | Sale Price | Title Company |
|---|---|---|---|
| Liu Curtis | -- | None Available | |
| Liu Curtis | $392,272 | First American Title Company | |
| Moras Henry | -- | -- | |
| Moras Henry | -- | -- | |
| Moras Henry | $266,500 | First American Title |
Source: Public Records
Mortgage History
| Date | Status | Borrower | Loan Amount |
|---|---|---|---|
| Previous Owner | Moras Henry | $130,000 |
Source: Public Records
Tax History
| Year | Tax Paid | Tax Assessment Tax Assessment Total Assessment is a certain percentage of the fair market value that is determined by local assessors to be the total taxable value of land and additions on the property. | Land | Improvement |
|---|---|---|---|---|
| 2025 | $12,264 | $943,444 | $630,967 | $312,477 |
| 2024 | $12,264 | $924,946 | $618,596 | $306,350 |
| 2023 | $12,264 | $906,811 | $606,467 | $300,344 |
| 2022 | $11,453 | $889,031 | $594,576 | $294,455 |
| 2021 | $11,365 | $871,600 | $582,918 | $288,682 |
| 2020 | $11,098 | $862,663 | $576,941 | $285,722 |
| 2019 | $10,854 | $845,749 | $565,629 | $280,120 |
| 2018 | $10,702 | $829,167 | $554,539 | $274,628 |
| 2017 | $10,705 | $812,910 | $543,666 | $269,244 |
| 2016 | $10,005 | $796,971 | $533,006 | $263,965 |
| 2015 | $5,081 | $368,347 | $200,416 | $167,931 |
| 2014 | $5,054 | $361,133 | $196,491 | $164,642 |
Source: Public Records
Map
Nearby Homes
Your Personal Tour Guide
Ask me questions while you tour the home.