Estimated Value: $460,000 - $501,197
3
Beds
3
Baths
1,414
Sq Ft
$338/Sq Ft
Est. Value
About This Home
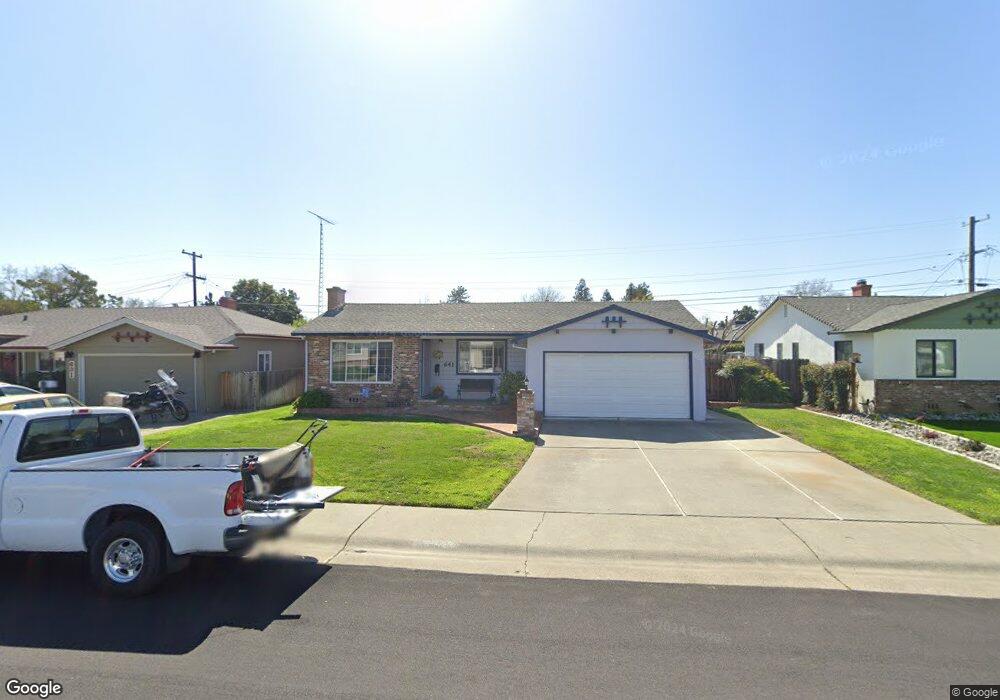
This home is located at 641 W D St N, Dixon, CA 95620 and is currently estimated at $477,299, approximately $337 per square foot. 641 W D St N is a home located in Solano County with nearby schools including Anderson (Linford L.) Elementary School, Dixon High School, and Dixon Montessori Charter.
Ownership History
Date
Name
Owned For
Owner Type
Purchase Details
Closed on
Jun 20, 2023
Sold by
Phyllis Ione Quiring Living Trust and Quiring Gregg D
Bought by
Edson Rebecca and Edson Carter
Current Estimated Value
Home Financials for this Owner
Home Financials are based on the most recent Mortgage that was taken out on this home.
Original Mortgage
$441,849
Outstanding Balance
$430,034
Interest Rate
6.39%
Mortgage Type
FHA
Estimated Equity
$47,265
Purchase Details
Closed on
May 27, 2009
Sold by
Quiring Phyllis I
Bought by
Quiring Phyllis Ione
Create a Home Valuation Report for This Property
The Home Valuation Report is an in-depth analysis detailing your home's value as well as a comparison with similar homes in the area
Home Values in the Area
Average Home Value in this Area
Purchase History
| Date | Buyer | Sale Price | Title Company |
|---|---|---|---|
| Edson Rebecca | $450,000 | Old Republic Title | |
| Quiring Phyllis Ione | -- | None Available |
Source: Public Records
Mortgage History
| Date | Status | Borrower | Loan Amount |
|---|---|---|---|
| Open | Edson Rebecca | $441,849 |
Source: Public Records
Tax History
| Year | Tax Paid | Tax Assessment Tax Assessment Total Assessment is a certain percentage of the fair market value that is determined by local assessors to be the total taxable value of land and additions on the property. | Land | Improvement |
|---|---|---|---|---|
| 2025 | $5,110 | $468,178 | $150,855 | $317,323 |
| 2024 | $5,110 | $458,999 | $147,898 | $311,101 |
| 2023 | $514 | $51,952 | $11,373 | $40,579 |
| 2022 | $505 | $50,934 | $11,150 | $39,784 |
| 2021 | $497 | $49,936 | $10,932 | $39,004 |
| 2020 | $489 | $49,425 | $10,820 | $38,605 |
| 2019 | $478 | $48,457 | $10,608 | $37,849 |
| 2018 | $475 | $47,507 | $10,400 | $37,107 |
| 2017 | $462 | $46,577 | $10,197 | $36,380 |
| 2016 | $430 | $45,665 | $9,998 | $35,667 |
| 2015 | $419 | $44,980 | $9,848 | $35,132 |
| 2014 | $413 | $44,100 | $9,656 | $34,444 |
Source: Public Records
Map
Nearby Homes
Your Personal Tour Guide
Ask me questions while you tour the home.