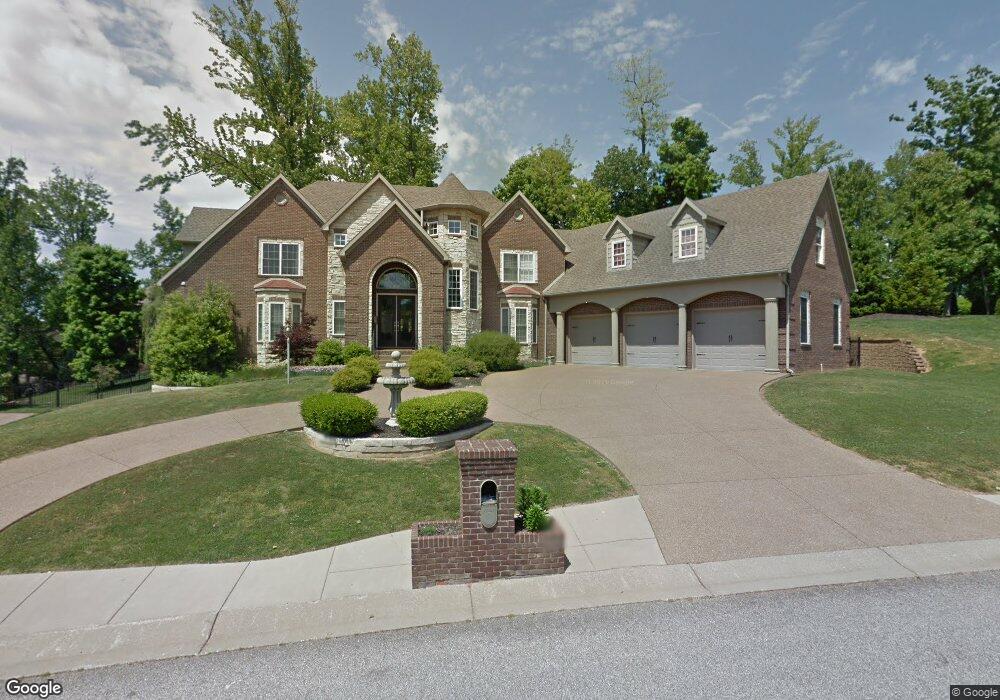
6411 Pebble Point Ct Newburgh, IN 47630
Estimated Value: $673,965 - $756,000
3
Beds
4
Baths
3,147
Sq Ft
$229/Sq Ft
Est. Value
About This Home
This home is located at 6411 Pebble Point Ct, Newburgh, IN 47630 and is currently estimated at $721,241, approximately $229 per square foot. 6411 Pebble Point Ct is a home located in Warrick County with nearby schools including Yankeetown Elementary School, Castle North Middle School, and Castle High School.
Ownership History
Date
Name
Owned For
Owner Type
Purchase Details
Closed on
Mar 1, 2018
Sold by
Rudd Del L
Bought by
Hoh Ernest L and Hoh Martha Q
Current Estimated Value
Home Financials for this Owner
Home Financials are based on the most recent Mortgage that was taken out on this home.
Original Mortgage
$421,200
Outstanding Balance
$359,556
Interest Rate
4.22%
Mortgage Type
New Conventional
Estimated Equity
$361,685
Create a Home Valuation Report for This Property
The Home Valuation Report is an in-depth analysis detailing your home's value as well as a comparison with similar homes in the area
Home Values in the Area
Average Home Value in this Area
Purchase History
| Date | Buyer | Sale Price | Title Company |
|---|---|---|---|
| Hoh Ernest L | -- | Regional Title Services Llc |
Source: Public Records
Mortgage History
| Date | Status | Borrower | Loan Amount |
|---|---|---|---|
| Open | Hoh Ernest L | $421,200 |
Source: Public Records
Tax History Compared to Growth
Tax History
| Year | Tax Paid | Tax Assessment Tax Assessment Total Assessment is a certain percentage of the fair market value that is determined by local assessors to be the total taxable value of land and additions on the property. | Land | Improvement |
|---|---|---|---|---|
| 2024 | $4,863 | $587,600 | $41,500 | $546,100 |
| 2023 | $4,307 | $530,500 | $41,500 | $489,000 |
| 2022 | $4,375 | $511,000 | $37,700 | $473,300 |
| 2021 | $4,098 | $450,100 | $40,500 | $409,600 |
| 2020 | $3,926 | $416,800 | $39,200 | $377,600 |
| 2019 | $3,912 | $411,000 | $39,200 | $371,800 |
| 2018 | $3,668 | $399,100 | $39,200 | $359,900 |
| 2017 | $7,410 | $389,300 | $39,200 | $350,100 |
| 2016 | $3,513 | $388,200 | $36,900 | $351,300 |
| 2014 | $3,469 | $399,900 | $38,400 | $361,500 |
| 2013 | $3,361 | $396,900 | $38,400 | $358,500 |
Source: Public Records
Map
Nearby Homes
- 6444 Pebble Point Ct
- 6600 River Ridge Dr
- 6600 Red Horse Pike
- 6009 Pembrooke Dr
- 6800 Oakmont Ct
- 6977 Boyer Dr
- 7233 Stonebridge Rd
- 7366 Parkridge Rd
- 7399 S Shore Dr
- 6788 Holly Dr
- 6655 Blue Spruce Dr
- 6288 Sycamore Hollow
- Off S 66
- 5944 Riceland Dr
- 5266 Martin Rd
- 6195 Ashford Cir
- Sophia Plan at Lexington Subdivision
- Ava Plan at Lexington Subdivision
- 5600 Essex Dr
- 5322 Blue Ridge Dr
- 6433 Pebble Point Ct
- 6944 Winddrift Ct
- 6400 Winddrift Ct
- 6966 Winddrift Ct
- 6400 Pebble Point Ct
- 6455 Pebble Point Ct
- 6988 Winddrift Ct
- 6944 Bayhill Ct
- 6622 River Ridge Dr
- 6955 Bayhill Ct
- 6466 Pebble Point Ct
- 6588 River Ridge Dr
- 6992 Winddrift Ct
- 6644 River Ridge Dr
- 6477 Pebble Point Ct
- 6411 Waterstone Ct
- 6401 Waterstone Ct
- 6977 Winddrift Ct
- 6966 Bayhill Ct
- 6566 River Ridge Dr