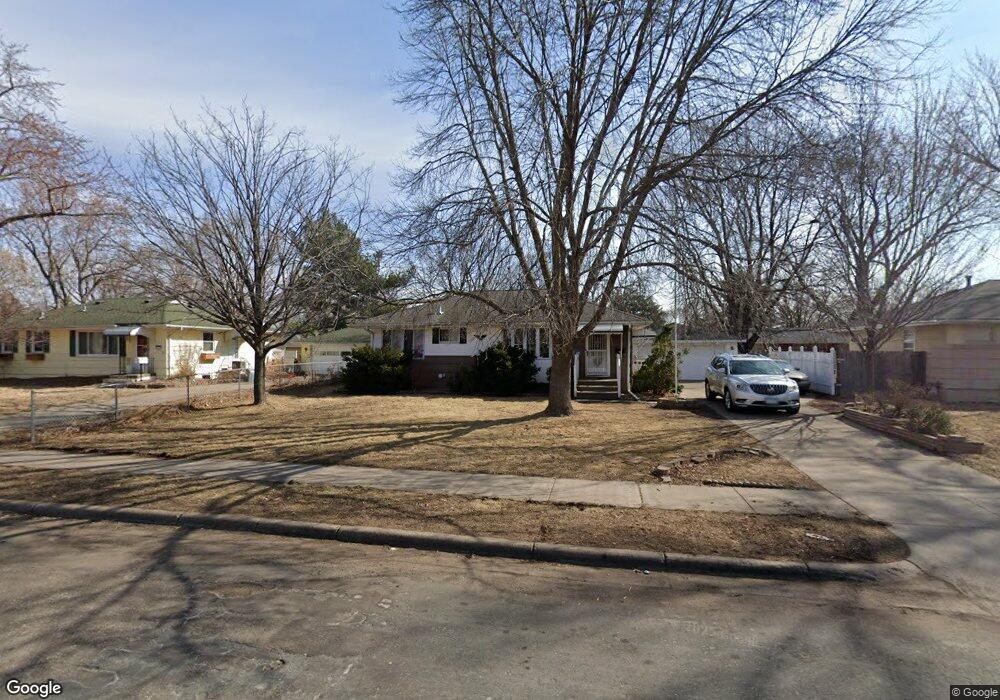
6412 Unity Ave N Minneapolis, MN 55429
Orchard Lake NeighborhoodEstimated Value: $288,000 - $319,000
3
Beds
2
Baths
1,908
Sq Ft
$161/Sq Ft
Est. Value
About This Home
This home is located at 6412 Unity Ave N, Minneapolis, MN 55429 and is currently estimated at $307,942, approximately $161 per square foot. 6412 Unity Ave N is a home located in Hennepin County with nearby schools including Fair Oaks Elementary School, Maple Grove Middle School, and Park Center Senior High.
Ownership History
Date
Name
Owned For
Owner Type
Purchase Details
Closed on
May 6, 2021
Sold by
Hang Chang and Hang Wendy M
Bought by
Edwards Tokeno
Current Estimated Value
Home Financials for this Owner
Home Financials are based on the most recent Mortgage that was taken out on this home.
Original Mortgage
$17,000
Outstanding Balance
$10,102
Interest Rate
2.26%
Mortgage Type
New Conventional
Estimated Equity
$297,840
Purchase Details
Closed on
Oct 5, 2018
Sold by
Jennie Amanda K and Schmidt Bradley T
Bought by
Hang Chang and Hang Wendy M
Home Financials for this Owner
Home Financials are based on the most recent Mortgage that was taken out on this home.
Original Mortgage
$147,900
Interest Rate
4.5%
Mortgage Type
New Conventional
Purchase Details
Closed on
Mar 26, 2015
Sold by
Skogman Patricia A
Bought by
Jennie Amanda K and Schmidt Bradley T
Home Financials for this Owner
Home Financials are based on the most recent Mortgage that was taken out on this home.
Original Mortgage
$148,657
Interest Rate
3.87%
Mortgage Type
FHA
Create a Home Valuation Report for This Property
The Home Valuation Report is an in-depth analysis detailing your home's value as well as a comparison with similar homes in the area
Home Values in the Area
Average Home Value in this Area
Purchase History
| Date | Buyer | Sale Price | Title Company |
|---|---|---|---|
| Edwards Tokeno | $265,000 | Executive Title | |
| Hang Chang | $174,000 | On Site Title | |
| Jennie Amanda K | $151,400 | At Home Title | |
| Edwards Tokeno Tokeno | $265,000 | -- |
Source: Public Records
Mortgage History
| Date | Status | Borrower | Loan Amount |
|---|---|---|---|
| Open | Edwards Tokeno | $17,000 | |
| Open | Edwards Tokeno | $260,200 | |
| Previous Owner | Hang Chang | $147,900 | |
| Previous Owner | Jennie Amanda K | $148,657 | |
| Closed | Edwards Tokeno Tokeno | $260,200 |
Source: Public Records
Tax History Compared to Growth
Tax History
| Year | Tax Paid | Tax Assessment Tax Assessment Total Assessment is a certain percentage of the fair market value that is determined by local assessors to be the total taxable value of land and additions on the property. | Land | Improvement |
|---|---|---|---|---|
| 2024 | $4,113 | $283,300 | $88,000 | $195,300 |
| 2023 | $4,154 | $289,400 | $92,000 | $197,400 |
| 2022 | $3,256 | $276,000 | $88,000 | $188,000 |
| 2021 | $3,168 | $221,000 | $77,000 | $144,000 |
| 2020 | $3,028 | $200,000 | $61,000 | $139,000 |
| 2019 | $2,741 | $185,000 | $55,000 | $130,000 |
| 2018 | $2,214 | $175,000 | $52,000 | $123,000 |
| 2017 | $2,104 | $138,000 | $41,000 | $97,000 |
| 2016 | $1,985 | $130,400 | $44,500 | $85,900 |
| 2015 | $1,819 | $120,900 | $39,500 | $81,400 |
| 2014 | -- | $103,000 | $34,400 | $68,600 |
Source: Public Records
Map
Nearby Homes
- 6419 Vera Cruz Ln N
- 5224 65th Ave N
- 6318 Perry Ave N
- 6000 64th Ave N
- 6009 64th Ave N
- 6110 Regent Ave N
- 6413 Noble Ave N
- 6801 Toledo Ave N
- 6807 Quail Ave N
- 6456 Edgewood Ave N
- 4418 65th Ave N
- 4309 63rd Ave N
- 5325 70th Cir N
- 5331 70th Cir N
- 7073 Unity Ave N
- 4710 58th Ave N Unit 208
- 4710 58th Ave N Unit 202
- 4710 58th Ave N Unit 219
- 4710 58th Ave N Unit 221
- 4710 58th Ave N Unit 319
- 6412 Unity Ave N
- 6418 Unity Ave N
- 6406 Unity Ave N
- 6406 6406 Unity-Avenue-n
- 6419 6419 Unity Ave N
- 6419 Toledo Ave N
- 6425 Toledo Ave N
- 6424 Unity Ave N
- 6400 Unity Ave N
- 6413 Toledo Ave N
- 6413 Toledo Ave N
- 6413 Unity Ave N
- 6400 6400 Unity-Avenue-
- 6430 6430 Unity Ave N
- 6419 Unity Ave N
- 6431 Toledo Ave N
- 6407 Unity Ave N
- 6407 Toledo Ave N
- 6430 Unity Ave N
- 6342 Unity Ave N