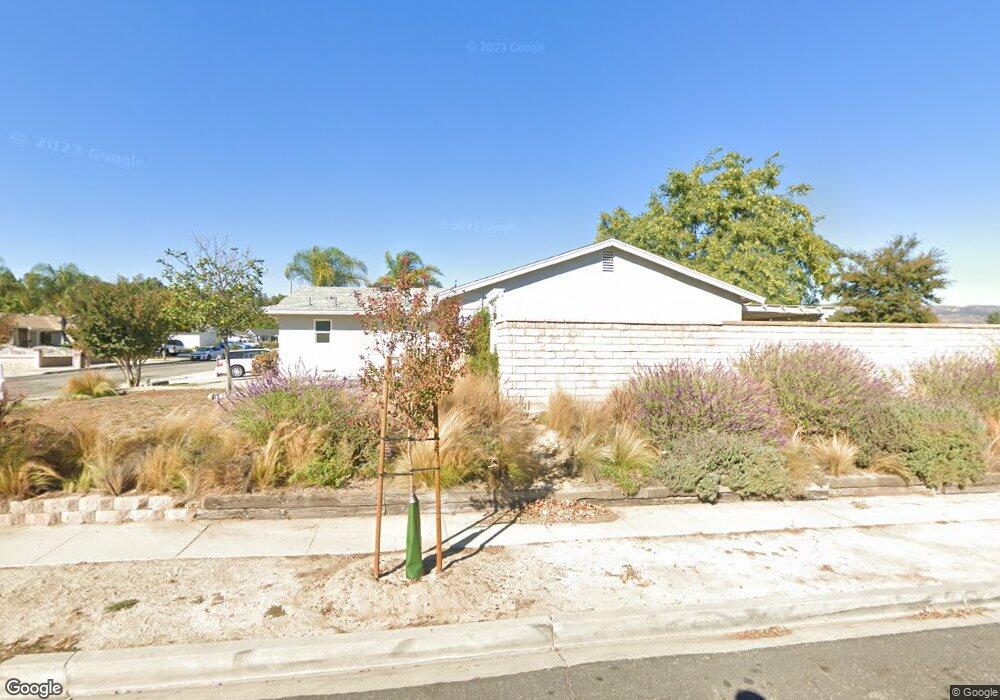
6412 Vassar Cir Moorpark, CA 93021
Estimated Value: $592,000 - $784,000
3
Beds
2
Baths
988
Sq Ft
$713/Sq Ft
Est. Value
About This Home
This home is located at 6412 Vassar Cir, Moorpark, CA 93021 and is currently estimated at $704,713, approximately $713 per square foot. 6412 Vassar Cir is a home located in Ventura County with nearby schools including Campus Canyon College Preparatory Academy, Moorpark High School, and Ivytech Charter School.
Ownership History
Date
Name
Owned For
Owner Type
Purchase Details
Closed on
May 1, 2014
Sold by
Pratt Alfred and Pratt Alicia
Bought by
Pratt Alfred and Pratt Alicia
Current Estimated Value
Purchase Details
Closed on
Aug 18, 2009
Sold by
Kemp Frederick C
Bought by
Pratt Alfred and Pratt Alicia
Home Financials for this Owner
Home Financials are based on the most recent Mortgage that was taken out on this home.
Original Mortgage
$222,800
Outstanding Balance
$145,563
Interest Rate
5.25%
Mortgage Type
New Conventional
Estimated Equity
$559,150
Purchase Details
Closed on
Oct 16, 2003
Sold by
Kemp Melanie G
Bought by
Kemp Frederick C
Purchase Details
Closed on
Dec 21, 1993
Sold by
Kemp Melanie Gay
Bought by
Kemp Frederick C
Home Financials for this Owner
Home Financials are based on the most recent Mortgage that was taken out on this home.
Original Mortgage
$95,000
Interest Rate
6.59%
Create a Home Valuation Report for This Property
The Home Valuation Report is an in-depth analysis detailing your home's value as well as a comparison with similar homes in the area
Home Values in the Area
Average Home Value in this Area
Purchase History
| Date | Buyer | Sale Price | Title Company |
|---|---|---|---|
| Pratt Alfred | -- | None Available | |
| Pratt Alfred | $278,500 | Chicago Title Company | |
| Kemp Frederick C | -- | Chicago Title Co | |
| Kemp Frederick C | -- | First American Title Ins Co |
Source: Public Records
Mortgage History
| Date | Status | Borrower | Loan Amount |
|---|---|---|---|
| Open | Pratt Alfred | $222,800 | |
| Previous Owner | Kemp Frederick C | $95,000 |
Source: Public Records
Tax History Compared to Growth
Tax History
| Year | Tax Paid | Tax Assessment Tax Assessment Total Assessment is a certain percentage of the fair market value that is determined by local assessors to be the total taxable value of land and additions on the property. | Land | Improvement |
|---|---|---|---|---|
| 2025 | $3,836 | $359,478 | $179,739 | $179,739 |
| 2024 | $3,836 | $352,430 | $176,215 | $176,215 |
| 2023 | $3,750 | $345,520 | $172,760 | $172,760 |
| 2022 | $3,652 | $338,746 | $169,373 | $169,373 |
| 2021 | $3,642 | $332,104 | $166,052 | $166,052 |
| 2020 | $3,608 | $328,700 | $164,350 | $164,350 |
| 2019 | $3,526 | $322,256 | $161,128 | $161,128 |
| 2018 | $3,488 | $315,938 | $157,969 | $157,969 |
| 2017 | $3,415 | $309,744 | $154,872 | $154,872 |
| 2016 | $3,349 | $303,672 | $151,836 | $151,836 |
| 2015 | $3,302 | $299,112 | $149,556 | $149,556 |
| 2014 | $3,212 | $293,254 | $146,627 | $146,627 |
Source: Public Records
Map
Nearby Homes
- 14855 Campus Park Dr Unit D
- 14885 Campus Park Dr Unit C
- 6412 Penn St Unit C
- 15020 Varsity St Unit A
- 15076 Varsity St Unit A
- 6899 Chapman Place
- 14744 Marymount St
- 6590 Marquette St Unit C
- 14720 Marymount St
- 15242 Campus Park Dr Unit E
- 15175 Marquette St Unit C
- 15266 Campus Park Dr Unit F
- 14291 Clemson St
- 15444 Dracena Ave
- 15299 Middle Ranch Rd
- 0 N Grimes Canyon Rd Unit V1-29783
- 6860 Ivy Creek Way Unit 6860
- 6422 Beragan St
- 15750 Arroyo Dr Unit 214
- 15750 Arroyo Dr Unit 227
- 6428 Vassar Cir
- 6413 Harvard St
- 6439 Harvard St
- 6446 Vassar Cir
- 14818 Hartford St
- 6411 Vassar Cir
- 14836 Hartford St
- 6427 Vassar Cir
- 14804 Hartford St
- 6461 Harvard St
- 14850 Hartford St
- 6445 Vassar Cir
- 6462 Vassar Cir
- 14790 Hartford St
- 6461 Vassar Cir
- 14776 Hartford St
- 6410 Pepperdine Cir
- 6426 Pepperdine Cir
- 14864 Hartford St