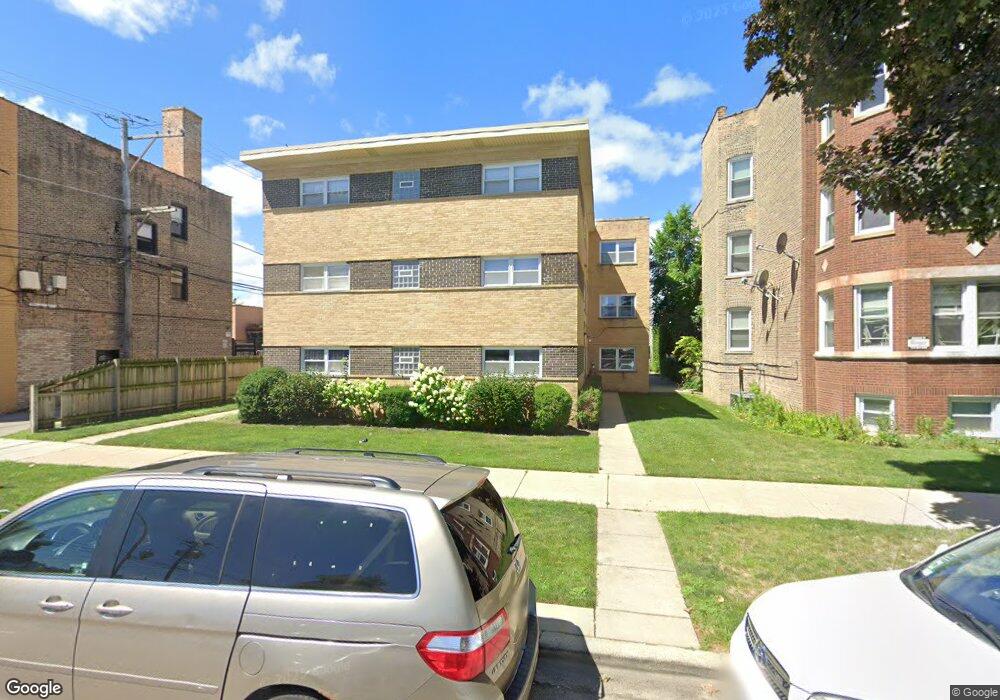
6414 N Mozart St Unit 3N Chicago, IL 60645
West Ridge NeighborhoodEstimated Value: $226,000 - $238,000
2
Beds
2
Baths
1,200
Sq Ft
$191/Sq Ft
Est. Value
About This Home
This home is located at 6414 N Mozart St Unit 3N, Chicago, IL 60645 and is currently estimated at $229,663, approximately $191 per square foot. 6414 N Mozart St Unit 3N is a home located in Cook County with nearby schools including West Ridge Elementary School, Mather High School, and Yeshivas Tiferes Tzvi Academy.
Ownership History
Date
Name
Owned For
Owner Type
Purchase Details
Closed on
Apr 16, 2019
Sold by
Simenovsky Ellen
Bought by
Rlt Ellen Haia Simenovsky
Current Estimated Value
Purchase Details
Closed on
Mar 13, 2007
Sold by
Simenovsky Sara
Bought by
Simenovsky Ellen
Purchase Details
Closed on
Feb 7, 2006
Sold by
6414 N Mozart Llc
Bought by
Simenovsky Sara
Home Financials for this Owner
Home Financials are based on the most recent Mortgage that was taken out on this home.
Original Mortgage
$77,000
Interest Rate
6%
Mortgage Type
Purchase Money Mortgage
Purchase Details
Closed on
Jan 8, 2006
Sold by
Simenovsky Sara
Bought by
Simenovsky Ellen and Simenovsky Sara
Home Financials for this Owner
Home Financials are based on the most recent Mortgage that was taken out on this home.
Original Mortgage
$77,000
Interest Rate
6%
Mortgage Type
Purchase Money Mortgage
Create a Home Valuation Report for This Property
The Home Valuation Report is an in-depth analysis detailing your home's value as well as a comparison with similar homes in the area
Home Values in the Area
Average Home Value in this Area
Purchase History
| Date | Buyer | Sale Price | Title Company |
|---|---|---|---|
| Rlt Ellen Haia Simenovsky | -- | Attorney | |
| Simenovsky Ellen | -- | First American Title Ins Co | |
| Simenovsky Sara | $230,000 | Cti | |
| Simenovsky Ellen | -- | First American Title Ins Co |
Source: Public Records
Mortgage History
| Date | Status | Borrower | Loan Amount |
|---|---|---|---|
| Previous Owner | Simenovsky Sara | $77,000 |
Source: Public Records
Tax History Compared to Growth
Tax History
| Year | Tax Paid | Tax Assessment Tax Assessment Total Assessment is a certain percentage of the fair market value that is determined by local assessors to be the total taxable value of land and additions on the property. | Land | Improvement |
|---|---|---|---|---|
| 2024 | $3,586 | $19,918 | $2,237 | $17,681 |
| 2023 | $3,496 | $17,000 | $1,790 | $15,210 |
| 2022 | $3,496 | $17,000 | $1,790 | $15,210 |
| 2021 | $3,418 | $16,998 | $1,789 | $15,209 |
| 2020 | $1,787 | $8,022 | $1,521 | $6,501 |
| 2019 | $1,804 | $8,981 | $1,521 | $7,460 |
| 2018 | $1,774 | $8,981 | $1,521 | $7,460 |
| 2017 | $1,981 | $9,202 | $1,342 | $7,860 |
| 2016 | $1,843 | $9,202 | $1,342 | $7,860 |
| 2015 | $1,686 | $9,202 | $1,342 | $7,860 |
| 2014 | $2,143 | $11,549 | $1,208 | $10,341 |
| 2013 | $2,101 | $11,549 | $1,208 | $10,341 |
Source: Public Records
Map
Nearby Homes
- 6451 N California Ave Unit 2
- 6457 N California Ave Unit 3
- 6517 N California Ave Unit 303
- 6508 N Richmond St Unit 1D
- 6400 N Sacramento Ave Unit 205
- 6312 N Fairfield Ave Unit 3A
- 6312 N Fairfield Ave Unit 3B
- 6235 N Mozart St
- 6345 N Washtenaw Ave Unit GW
- 6558 N Washtenaw Ave Unit 2
- 6504 N Whipple St
- 6214 N Mozart St Unit 3E
- 6418 N Rockwell St
- 6414 N Rockwell St
- 6418 N Albany Ave Unit 1AE
- 6151 N Mozart St
- 6212 N Sacramento Ave
- 6544 N Albany Ave
- 3105 W Wallen Ave
- 2554 W Rosemont Ave Unit G
- 6414 N Mozart St Unit 3S
- 6414 N Mozart St Unit 1S
- 6414 N Mozart St Unit 1N
- 6414 N Mozart St Unit 2N
- 6414 N Mozart St Unit 2S
- 6414 N Mozart St Unit 1E
- 6414 N Mozart St Unit 3E
- 6414 N Mozart St Unit 2E
- 6422 N Mozart St Unit 3
- 6422 N Mozart St Unit 3
- 6422 N Mozart St
- 6410 N Mozart St Unit 1
- 6424 N Mozart St Unit 1
- 6428 N Mozart St Unit GDN
- 6428 N Mozart St Unit 2
- 6428 N Mozart St Unit 1
- 2832 W Devon Ave
- 2836 W Devon Ave
- 6406 N Mozart St Unit 1
- 6419 N Francisco Ave Unit 1B