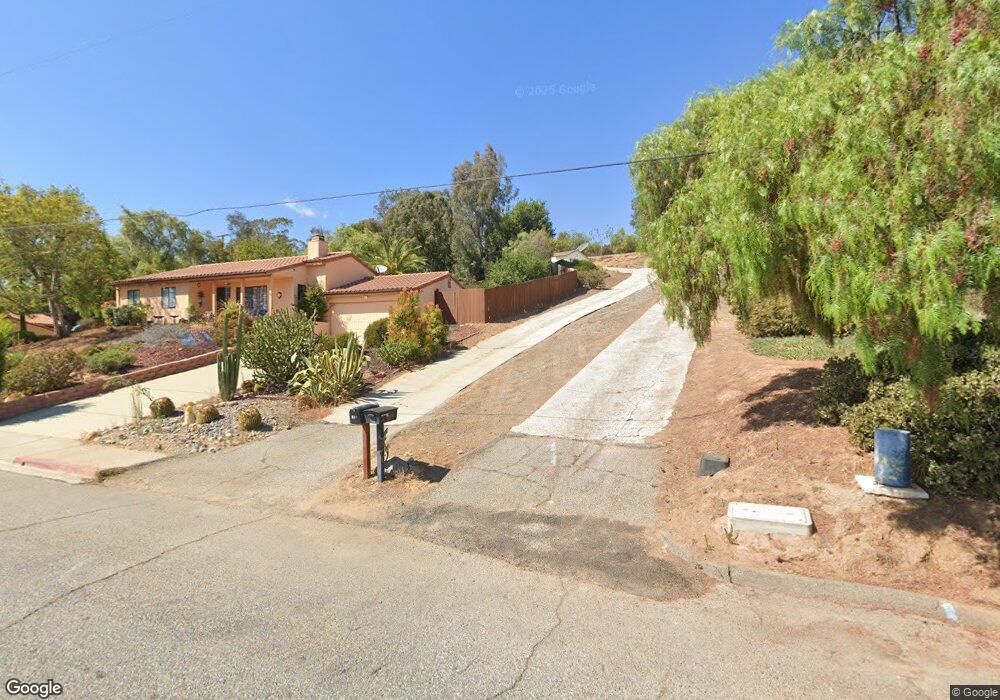
642 Imperial Dr Escondido, CA 92026
North Broadway NeighborhoodEstimated Value: $656,000 - $764,536
3
Beds
2
Baths
1,188
Sq Ft
$588/Sq Ft
Est. Value
About This Home
This home is located at 642 Imperial Dr, Escondido, CA 92026 and is currently estimated at $699,134, approximately $588 per square foot. 642 Imperial Dr is a home located in San Diego County with nearby schools including North Broadway Elementary School, Rincon Middle School, and Escondido High School.
Ownership History
Date
Name
Owned For
Owner Type
Purchase Details
Closed on
Jun 21, 2017
Sold by
Herderson David T and Henderson Donna Fe
Bought by
Henderson David T and Henderson Donna Fe
Current Estimated Value
Home Financials for this Owner
Home Financials are based on the most recent Mortgage that was taken out on this home.
Original Mortgage
$59,500
Outstanding Balance
$40,536
Interest Rate
4.02%
Mortgage Type
New Conventional
Estimated Equity
$658,598
Purchase Details
Closed on
Apr 8, 2005
Sold by
Henderson Gary A and Henderson Carolyn Sue
Bought by
Henderson Carolyn Sue
Home Financials for this Owner
Home Financials are based on the most recent Mortgage that was taken out on this home.
Original Mortgage
$40,000
Interest Rate
5.92%
Mortgage Type
Credit Line Revolving
Purchase Details
Closed on
Apr 26, 2000
Sold by
Henderson Gary A and Henderson Carolyn S
Bought by
Henderson Gary A and Henderson Carolyn Sue
Purchase Details
Closed on
Aug 27, 1992
Create a Home Valuation Report for This Property
The Home Valuation Report is an in-depth analysis detailing your home's value as well as a comparison with similar homes in the area
Home Values in the Area
Average Home Value in this Area
Purchase History
| Date | Buyer | Sale Price | Title Company |
|---|---|---|---|
| Henderson David T | -- | Timios Title | |
| Henderson Carolyn Sue | -- | New Century Title Company Sa | |
| Henderson Gary A | -- | -- | |
| Henderson Gary A | -- | -- | |
| -- | $142,900 | -- |
Source: Public Records
Mortgage History
| Date | Status | Borrower | Loan Amount |
|---|---|---|---|
| Open | Henderson David T | $59,500 | |
| Closed | Henderson Carolyn Sue | $40,000 |
Source: Public Records
Tax History Compared to Growth
Tax History
| Year | Tax Paid | Tax Assessment Tax Assessment Total Assessment is a certain percentage of the fair market value that is determined by local assessors to be the total taxable value of land and additions on the property. | Land | Improvement |
|---|---|---|---|---|
| 2025 | $2,880 | $261,923 | $104,213 | $157,710 |
| 2024 | $2,880 | $256,788 | $102,170 | $154,618 |
| 2023 | $2,813 | $251,754 | $100,167 | $151,587 |
| 2022 | $2,782 | $246,818 | $98,203 | $148,615 |
| 2021 | $2,736 | $241,979 | $96,278 | $145,701 |
| 2020 | $2,719 | $239,499 | $95,291 | $144,208 |
| 2019 | $2,652 | $234,804 | $93,423 | $141,381 |
| 2018 | $2,578 | $230,201 | $91,592 | $138,609 |
| 2017 | $2,534 | $225,689 | $89,797 | $135,892 |
| 2016 | $2,484 | $221,265 | $88,037 | $133,228 |
| 2015 | $2,462 | $217,942 | $86,715 | $131,227 |
| 2014 | $2,359 | $213,674 | $85,017 | $128,657 |
Source: Public Records
Map
Nearby Homes
- 2101 Ridgeview Place
- 530 Smoketree Glen
- 401 Blueridge Place
- 1110 San Jacinto Glen
- 228 Crestview Glen
- 1829 Nova Glen
- 242 Eveningside Glen
- 2109 N Nutmeg St
- 550 W El Norte Pkwy
- 1113 Barry Place
- 1811 Lynx Glen
- 322 Mahogany Glen
- 1810 Lynx Glen
- 361 Mahogany Glen
- 1230 Portola Ave
- 1261 La Mirada Ave
- 25111 N Centre City Pkwy Unit 30
- 2034 Bolsa Chica Glen
- 2243 N Nutmeg St
- 0 Rockhoff Rd Unit 58 250037554
- 654 Imperial Dr
- 650 Imperial Dr
- 658 Imperial Dr
- 636 Imperial Dr
- 630 Imperial Dr
- 708 Imperial Dr
- 2000 Montego Ave
- 736 Imperial Dr
- 2093 Grandview Ct
- 1935 Greenview Rd
- 740 Imperial Dr
- 743 Imperial Dr
- 1967 Greenview Rd
- 0 N Center City Pkwy Unit 86010482
- 0 N Center City Pkwy Unit 31 210033221
- 310 Greenview Rd
- 1939 Greenview Rd
- 1959 Greenview Rd
- 0 Imperial Dr Unit 90013186
- 0 Imperial Dr Unit 90070204