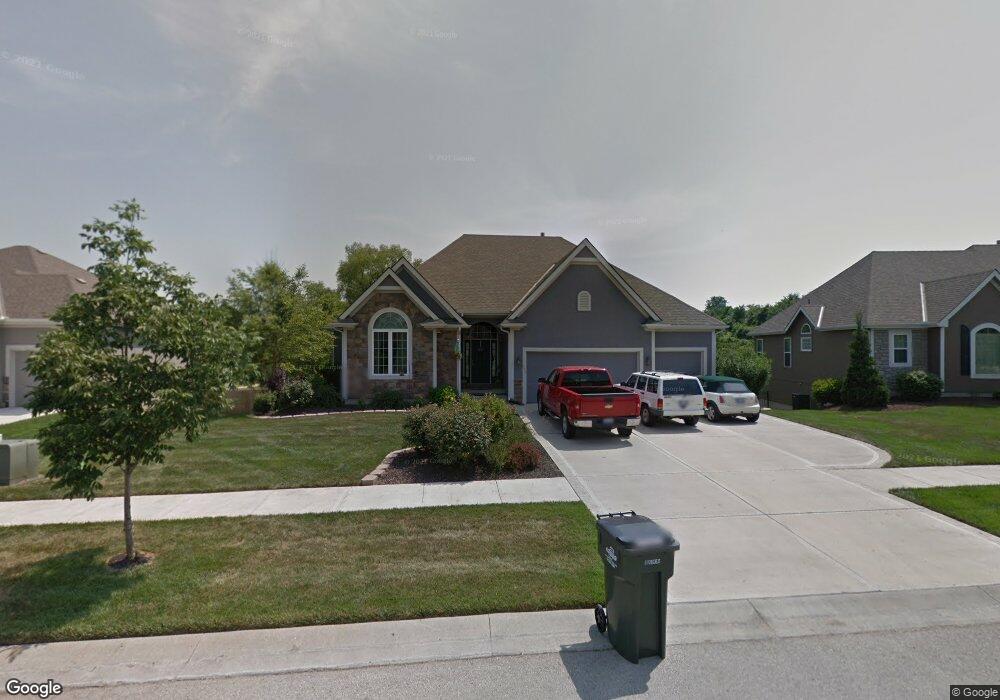
643 Willow St Lansing, KS 66043
Estimated Value: $460,000 - $489,000
4
Beds
4
Baths
2,110
Sq Ft
$223/Sq Ft
Est. Value
About This Home
This home is located at 643 Willow St, Lansing, KS 66043 and is currently estimated at $469,724, approximately $222 per square foot. 643 Willow St is a home located in Leavenworth County with nearby schools including Lansing Elementary School, Lansing Middle 6-8, and Lansing High 9-12.
Ownership History
Date
Name
Owned For
Owner Type
Purchase Details
Closed on
Oct 8, 2020
Sold by
Pedersen Richard N and Pedersen April I
Bought by
Pedersen Richard N
Current Estimated Value
Home Financials for this Owner
Home Financials are based on the most recent Mortgage that was taken out on this home.
Original Mortgage
$342,089
Interest Rate
3.69%
Mortgage Type
VA
Purchase Details
Closed on
Jun 16, 2008
Sold by
Jmk Partners Llc
Bought by
Pedersen Richard N and Pedersen April I
Create a Home Valuation Report for This Property
The Home Valuation Report is an in-depth analysis detailing your home's value as well as a comparison with similar homes in the area
Home Values in the Area
Average Home Value in this Area
Purchase History
| Date | Buyer | Sale Price | Title Company |
|---|---|---|---|
| Pedersen Richard N | -- | New Title Company Name | |
| Pedersen Richard N | $404,936 | -- |
Source: Public Records
Mortgage History
| Date | Status | Borrower | Loan Amount |
|---|---|---|---|
| Previous Owner | Pedersen Richard N | $342,089 |
Source: Public Records
Tax History
| Year | Tax Paid | Tax Assessment Tax Assessment Total Assessment is a certain percentage of the fair market value that is determined by local assessors to be the total taxable value of land and additions on the property. | Land | Improvement |
|---|---|---|---|---|
| 2025 | $7,434 | $56,846 | $5,786 | $51,060 |
| 2024 | $7,149 | $54,660 | $5,786 | $48,874 |
| 2023 | $7,149 | $54,660 | $5,786 | $48,874 |
| 2022 | $7,241 | $52,314 | $4,876 | $47,438 |
| 2021 | $6,782 | $46,923 | $4,876 | $42,047 |
| 2020 | $6,559 | $44,660 | $4,876 | $39,784 |
| 2019 | $6,568 | $44,660 | $4,876 | $39,784 |
| 2018 | $6,311 | $42,942 | $4,876 | $38,066 |
| 2017 | $6,140 | $41,691 | $4,876 | $36,815 |
| 2016 | $6,143 | $41,691 | $4,876 | $36,815 |
| 2015 | $6,124 | $41,691 | $4,876 | $36,815 |
| 2014 | $5,999 | $41,691 | $4,876 | $36,815 |
Source: Public Records
Map
Nearby Homes
- 875 Clearview Dr
- 111 Southfork Rd
- 1322 Rock Creek Ct
- 712 Rock Creek Dr
- 1221 S Desoto Rd
- 898 Clearview Dr
- 189 Canyon View Dr
- 1313 Stone Ln
- 922 Southfork St
- 811 4-H Rd
- 24431 139th St
- 26731 147th St
- 13965 Mc Intyre Rd
- 13788 McIntyre1 Rd
- 13788 Mcintyre Rd
- 13788 McIntyre2 Rd
- 503 S 1st St
- 202 S Main St
- 124 S Main St
- 215 E Mary St
Your Personal Tour Guide
Ask me questions while you tour the home.