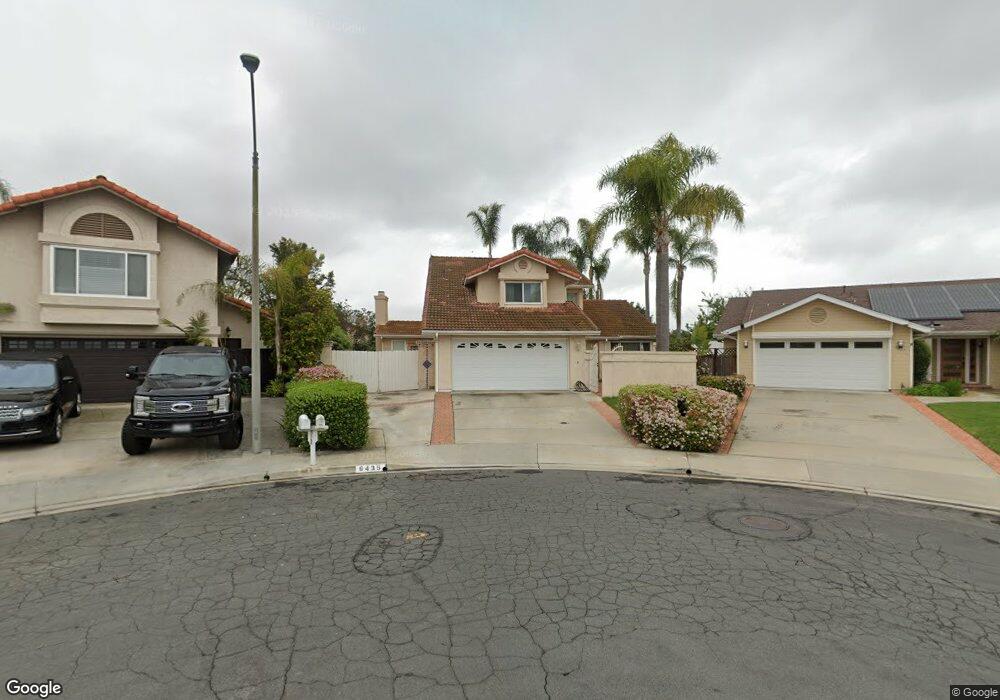
6439 La Garza Ct Carlsbad, CA 92009
La Costa NeighborhoodEstimated Value: $1,664,948 - $1,777,000
4
Beds
3
Baths
2,448
Sq Ft
$705/Sq Ft
Est. Value
About This Home
This home is located at 6439 La Garza Ct, Carlsbad, CA 92009 and is currently estimated at $1,726,737, approximately $705 per square foot. 6439 La Garza Ct is a home located in San Diego County with nearby schools including La Costa Meadows Elementary, San Elijo Middle School, and San Marcos High School.
Ownership History
Date
Name
Owned For
Owner Type
Purchase Details
Closed on
Aug 31, 2006
Sold by
Evangelista Robert and Evangelista Rachel
Bought by
Evangelista Robert and Evangelista Rachel
Current Estimated Value
Purchase Details
Closed on
Sep 25, 1998
Sold by
Uhlig Ronald P and Uhlig Beverly J
Bought by
Evangelista Robert and Evangelista Rachel
Purchase Details
Closed on
Aug 22, 1995
Sold by
Stanojevic George and Stanojevic Socorro H
Bought by
Uhlig Ronald Paul and Uhlig Beverly Jean
Home Financials for this Owner
Home Financials are based on the most recent Mortgage that was taken out on this home.
Original Mortgage
$232,000
Interest Rate
7.62%
Purchase Details
Closed on
Feb 28, 1990
Purchase Details
Closed on
Aug 30, 1984
Create a Home Valuation Report for This Property
The Home Valuation Report is an in-depth analysis detailing your home's value as well as a comparison with similar homes in the area
Home Values in the Area
Average Home Value in this Area
Purchase History
| Date | Buyer | Sale Price | Title Company |
|---|---|---|---|
| Evangelista Robert | -- | First American | |
| Evangelista Robert | $345,000 | First American Title | |
| Uhlig Ronald Paul | $290,000 | Orange Coast Title Company | |
| -- | $357,000 | -- | |
| -- | $174,000 | -- |
Source: Public Records
Mortgage History
| Date | Status | Borrower | Loan Amount |
|---|---|---|---|
| Previous Owner | Uhlig Ronald Paul | $232,000 |
Source: Public Records
Tax History Compared to Growth
Tax History
| Year | Tax Paid | Tax Assessment Tax Assessment Total Assessment is a certain percentage of the fair market value that is determined by local assessors to be the total taxable value of land and additions on the property. | Land | Improvement |
|---|---|---|---|---|
| 2025 | $5,882 | $556,812 | $282,179 | $274,633 |
| 2024 | $5,882 | $545,896 | $276,647 | $269,249 |
| 2023 | $5,768 | $535,193 | $271,223 | $263,970 |
| 2022 | $5,670 | $524,700 | $265,905 | $258,795 |
| 2021 | $5,571 | $514,413 | $260,692 | $253,721 |
| 2020 | $5,529 | $509,139 | $258,019 | $251,120 |
| 2019 | $5,502 | $499,157 | $252,960 | $246,197 |
| 2018 | $5,365 | $489,370 | $248,000 | $241,370 |
| 2017 | $5,260 | $479,776 | $243,138 | $236,638 |
| 2016 | $5,169 | $470,370 | $238,371 | $231,999 |
| 2015 | $5,094 | $463,306 | $234,791 | $228,515 |
| 2014 | $4,977 | $454,231 | $230,192 | $224,039 |
Source: Public Records
Map
Nearby Homes
- 6502 La Paloma St
- 6541 Vispera Place
- 2568 Abedul St
- 6712 Cantil St
- 6817 Vianda Ct
- 2515 Luciernaga St
- 6911 Goldstone Rd
- 7146 Argonauta Way
- 6844 Urubu St
- 7133 Obelisco Cir
- 2610 Acuna Ct
- 2930 Rancho Cortes
- 6977 Corte Langosta
- 1980 Marcasite Place
- 7215 El Fuerte St
- 6901 Tourmaline Place
- 2647 Marmol Ct
- 6562 Halite Place
- 6417 Terraza Portico
- 6911 Quail Place Unit C
- 6438 La Garza Ct
- 6437 La Garza Ct
- 2612 Colibri Ln
- 2614 Colibri Ln Unit 1
- 2610 Colibri Ln
- 6435 La Garza Ct
- 2616 Colibri Ln
- 6436 La Garza Ct
- 6434 La Garza Ct
- 2608 Colibri Ln
- 6433 La Garza Ct
- 6432 La Garza Ct
- 6431 La Garza Ct
- 2606 Colibri Ln
- 2620 Colibri Ln
- 6431 La Vanco Ct
- 6429 La Vanco Ct
- 6438 La Paloma St
- 6440 La Paloma St
- 2613 Colibri Ln