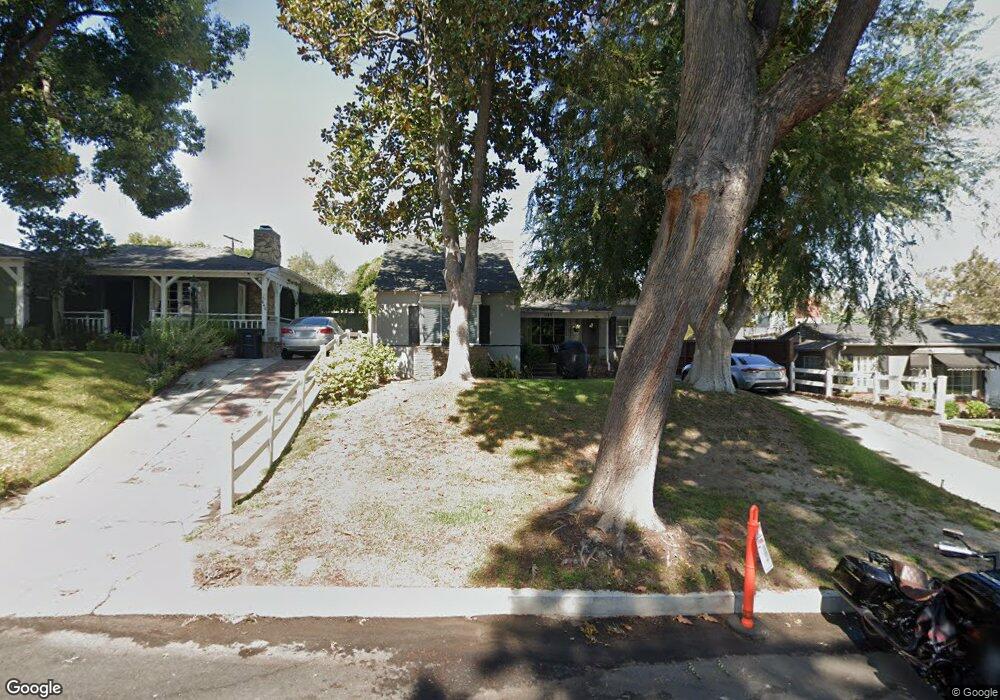
644 S Orchard Dr Burbank, CA 91506
Rancho Adjacent NeighborhoodEstimated Value: $1,307,000 - $1,706,000
2
Beds
2
Baths
1,362
Sq Ft
$1,103/Sq Ft
Est. Value
About This Home
This home is located at 644 S Orchard Dr, Burbank, CA 91506 and is currently estimated at $1,502,077, approximately $1,102 per square foot. 644 S Orchard Dr is a home located in Los Angeles County with nearby schools including William McKinley Elementary School, Dolores Huerta Middle School, and John Burroughs High School.
Ownership History
Date
Name
Owned For
Owner Type
Purchase Details
Closed on
Aug 5, 1999
Sold by
Moon Marian G and Moon Family Trust
Bought by
Minafra Stephen
Current Estimated Value
Home Financials for this Owner
Home Financials are based on the most recent Mortgage that was taken out on this home.
Original Mortgage
$230,000
Outstanding Balance
$65,991
Interest Rate
7.63%
Mortgage Type
Stand Alone First
Estimated Equity
$1,436,086
Purchase Details
Closed on
Oct 1, 1996
Sold by
Moon Robert L
Bought by
Moon Robert L and Moon Marian G
Purchase Details
Closed on
Sep 29, 1995
Sold by
Whitehead Scott R and Whitehead Linda L
Bought by
Moon Robert L and Moon Marian G
Home Financials for this Owner
Home Financials are based on the most recent Mortgage that was taken out on this home.
Original Mortgage
$220,000
Interest Rate
7.62%
Purchase Details
Closed on
Oct 26, 1993
Sold by
Green Laurie and Green Steven
Bought by
Whitehead Scott R
Home Financials for this Owner
Home Financials are based on the most recent Mortgage that was taken out on this home.
Original Mortgage
$218,700
Interest Rate
6.89%
Create a Home Valuation Report for This Property
The Home Valuation Report is an in-depth analysis detailing your home's value as well as a comparison with similar homes in the area
Home Values in the Area
Average Home Value in this Area
Purchase History
| Date | Buyer | Sale Price | Title Company |
|---|---|---|---|
| Minafra Stephen | $380,000 | Old Republic Title | |
| Moon Robert L | -- | -- | |
| Moon Robert L | $285,000 | Gateway Title Company | |
| Whitehead Scott R | $243,000 | American Coast Title |
Source: Public Records
Mortgage History
| Date | Status | Borrower | Loan Amount |
|---|---|---|---|
| Open | Minafra Stephen | $230,000 | |
| Previous Owner | Moon Robert L | $220,000 | |
| Previous Owner | Whitehead Scott R | $218,700 |
Source: Public Records
Tax History
| Year | Tax Paid | Tax Assessment Tax Assessment Total Assessment is a certain percentage of the fair market value that is determined by local assessors to be the total taxable value of land and additions on the property. | Land | Improvement |
|---|---|---|---|---|
| 2025 | $6,470 | $584,029 | $350,422 | $233,607 |
| 2024 | $6,470 | $572,578 | $343,551 | $229,027 |
| 2023 | $6,401 | $561,352 | $336,815 | $224,537 |
| 2022 | $6,112 | $550,346 | $330,211 | $220,135 |
| 2021 | $6,085 | $539,556 | $323,737 | $215,819 |
| 2019 | $5,840 | $523,555 | $314,136 | $209,419 |
| 2018 | $5,714 | $513,290 | $307,977 | $205,313 |
| 2016 | $5,421 | $493,361 | $296,019 | $197,342 |
| 2015 | $5,310 | $485,951 | $291,573 | $194,378 |
| 2014 | $5,298 | $476,433 | $285,862 | $190,571 |
Source: Public Records
Map
Nearby Homes
- 1524 W Riverside Dr
- 1925 W Parkside Ave
- 1305 W Riverside Dr
- 1406 W Valleyheart Dr
- 401 S Orchard Dr
- 612 S Mariposa St
- 345 S Beachwood Dr
- 104 Kimberwick Ct
- 101 Kimberwick Ct
- 106 Kimberwick Ct
- 525 S Shelton St Unit 205
- 107 Kimberwick Ct
- 149 Bridle Dr
- 139 Bridle Dr
- 419 S Griffith Park Dr
- 211 S Keystone St
- 121 N Myers St
- 340 S Lomita St
- 216 N Buena Vista St Unit 113
- 400 W Riverside Dr Unit 2
- 640 S Orchard Dr
- 648 S Orchard Dr
- 634 S Orchard Dr
- 645 S Reese Place
- 649 S Reese Place
- 639 S Reese Place
- 1713 W Riverside Dr
- 1711 W Riverside Dr
- 656 S Orchard Dr
- 628 S Orchard Dr
- 1707 W Riverside Dr
- 633 S Orchard Dr
- 651 S Orchard Dr
- 653 S Orchard Dr
- 631 S Reese Place
- 635 S Orchard Dr
- 1701 W Riverside Dr
- 627 S Reese Place
- 655 S Orchard Dr
- 624 S Orchard Dr
Your Personal Tour Guide
Ask me questions while you tour the home.