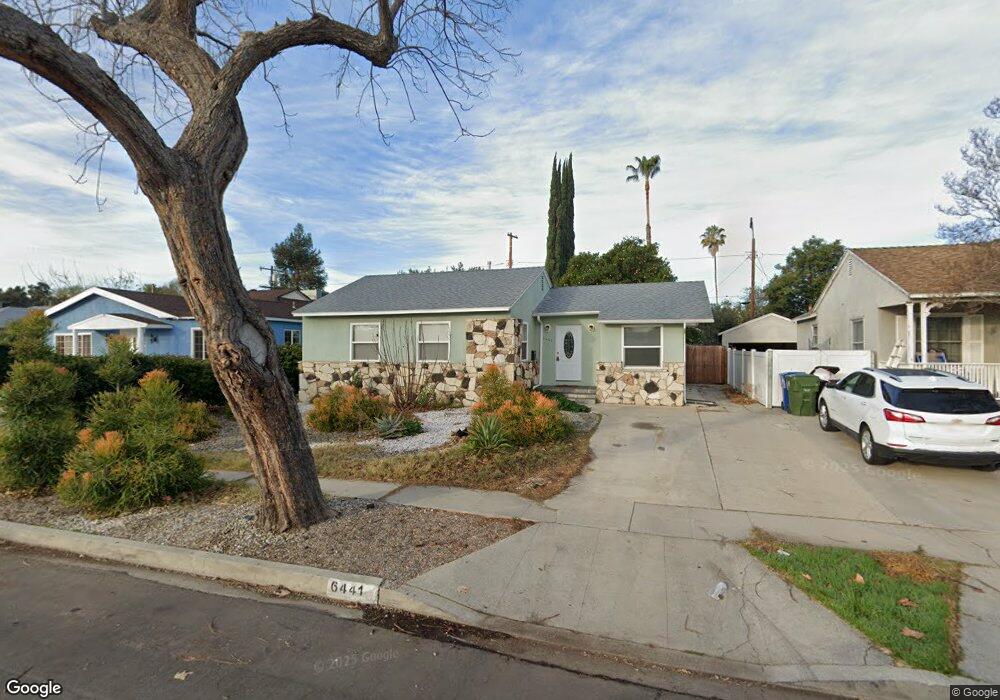
6441 Balcom Ave Reseda, CA 91335
Estimated Value: $697,969 - $876,000
2
Beds
1
Bath
811
Sq Ft
$953/Sq Ft
Est. Value
About This Home
This home is located at 6441 Balcom Ave, Reseda, CA 91335 and is currently estimated at $773,242, approximately $953 per square foot. 6441 Balcom Ave is a home located in Los Angeles County with nearby schools including Newcastle Elementary School, William Mulholland Middle, and Emelita Street Elementary.
Ownership History
Date
Name
Owned For
Owner Type
Purchase Details
Closed on
Aug 26, 2016
Sold by
Timewise Investments Llc
Bought by
Touboul Karen and Touboul Gilad
Current Estimated Value
Purchase Details
Closed on
Sep 25, 2003
Sold by
Greenberg Adam
Bought by
Timewise Investments Llc
Home Financials for this Owner
Home Financials are based on the most recent Mortgage that was taken out on this home.
Original Mortgage
$210,000
Interest Rate
5.6%
Mortgage Type
Purchase Money Mortgage
Purchase Details
Closed on
Aug 15, 2003
Sold by
Timewise Investments Llc
Bought by
Greenberg Adam and Greenberg Varda
Home Financials for this Owner
Home Financials are based on the most recent Mortgage that was taken out on this home.
Original Mortgage
$210,000
Interest Rate
5.6%
Mortgage Type
Purchase Money Mortgage
Purchase Details
Closed on
May 17, 1999
Sold by
Greenberg Adam
Bought by
Timewise Investments Llc
Purchase Details
Closed on
Aug 8, 1997
Sold by
Greenberg Adam
Bought by
Greenberg Adam and Greenberg Varda
Create a Home Valuation Report for This Property
The Home Valuation Report is an in-depth analysis detailing your home's value as well as a comparison with similar homes in the area
Home Values in the Area
Average Home Value in this Area
Purchase History
| Date | Buyer | Sale Price | Title Company |
|---|---|---|---|
| Touboul Karen | -- | None Available | |
| Timewise Investments Llc | -- | -- | |
| Greenberg Adam | -- | Provident Title Company | |
| Timewise Investments Llc | -- | Chicago Title | |
| Greenberg Adam | -- | -- |
Source: Public Records
Mortgage History
| Date | Status | Borrower | Loan Amount |
|---|---|---|---|
| Previous Owner | Greenberg Adam | $210,000 |
Source: Public Records
Tax History
| Year | Tax Paid | Tax Assessment Tax Assessment Total Assessment is a certain percentage of the fair market value that is determined by local assessors to be the total taxable value of land and additions on the property. | Land | Improvement |
|---|---|---|---|---|
| 2025 | $6,664 | $545,468 | $429,412 | $116,056 |
| 2024 | $6,664 | $534,774 | $420,993 | $113,781 |
| 2023 | $6,537 | $524,289 | $412,739 | $111,550 |
| 2022 | $6,235 | $514,010 | $404,647 | $109,363 |
| 2021 | $6,160 | $503,932 | $396,713 | $107,219 |
| 2019 | $5,977 | $488,988 | $384,948 | $104,040 |
| 2018 | $5,925 | $479,400 | $377,400 | $102,000 |
| 2016 | $2,036 | $156,113 | $61,757 | $94,356 |
| 2015 | $2,008 | $153,769 | $60,830 | $92,939 |
| 2014 | $2,024 | $150,758 | $59,639 | $91,119 |
Source: Public Records
Map
Nearby Homes
- 17643 Haynes St
- 17806 Erwin St
- 6659 Zelzah Ave
- 6438 Lindley Ave
- 17649 Lemay St
- 17527 Haynes St
- 17650 Welby Way
- 6714 Jellico Ave
- 6737 Jellico Ave
- 6160 Shoshone Ave
- 6820 Jellico Ave
- 17905 Bullock St
- 18147 Archwood St
- 18149 Welby Way
- 6930 Balcom Ave
- 6923 Enfield Ave
- 17469 Bullock St
- 6254 Etiwanda Ave
- 5945 Hesperia Ave
- 18019 Tiara St
- 6435 Balcom Ave
- 6447 Balcom Ave
- 6429 Balcom Ave
- 6451 Balcom Ave
- 6440 Jamieson Ave
- 6436 Jamieson Ave
- 6446 Jamieson Ave
- 6425 Balcom Ave
- 6432 Jamieson Ave
- 6452 Jamieson Ave
- 6457 Balcom Ave
- 6442 Balcom Ave
- 6436 Balcom Ave
- 6448 Balcom Ave
- 6432 Balcom Ave
- 6458 Jamieson Ave
- 6419 Balcom Ave
- 6452 Balcom Ave
- 6426 Jamieson Ave
- 6426 Balcom Ave
Your Personal Tour Guide
Ask me questions while you tour the home.