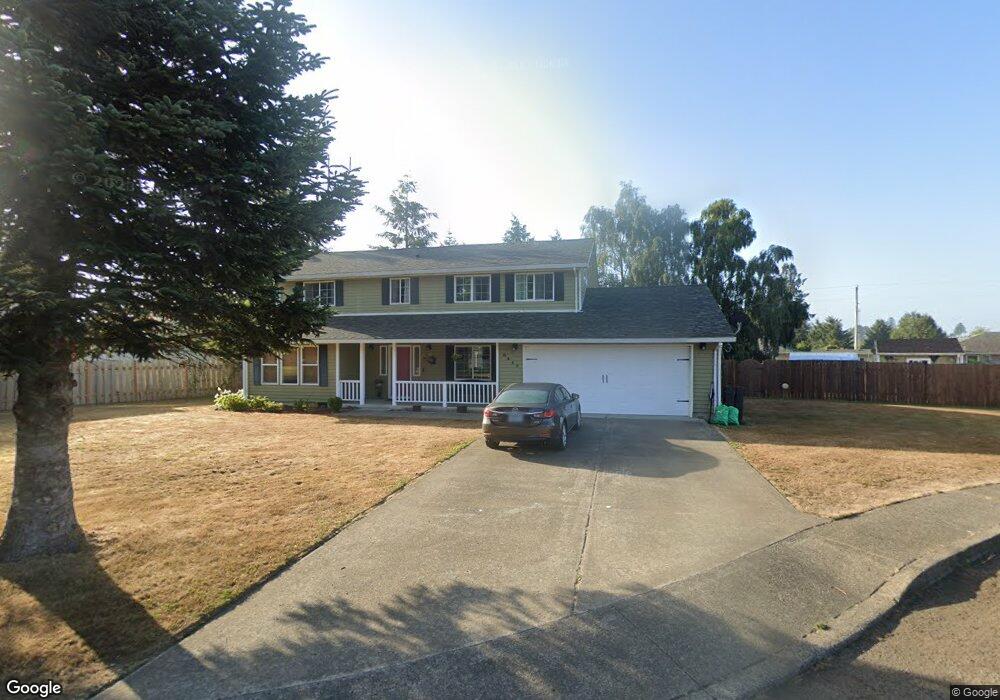
6445 Colonial Way Tillamook, OR 97141
Estimated Value: $519,625 - $580,000
4
Beds
3
Baths
2,084
Sq Ft
$261/Sq Ft
Est. Value
About This Home
This home is located at 6445 Colonial Way, Tillamook, OR 97141 and is currently estimated at $544,906, approximately $261 per square foot. 6445 Colonial Way is a home located in Tillamook County with nearby schools including Tillamook High School, Tillamook Adventist School, and Little Clipper Preschool.
Ownership History
Date
Name
Owned For
Owner Type
Purchase Details
Closed on
Jan 27, 2020
Sold by
Steenbergen Janelle T and Allen Janelle T
Bought by
Allen Daniel W
Current Estimated Value
Purchase Details
Closed on
Oct 5, 2016
Sold by
Churchill Joel J and Churchill Tara J
Bought by
Allen Daniel W and Allen Janelle T
Home Financials for this Owner
Home Financials are based on the most recent Mortgage that was taken out on this home.
Original Mortgage
$231,200
Outstanding Balance
$185,174
Interest Rate
3.43%
Mortgage Type
New Conventional
Estimated Equity
$359,732
Purchase Details
Closed on
Jul 27, 2011
Sold by
Palmer Charles E and Palmer Susan M
Bought by
Churchill Joel J and Churchill Tara J
Home Financials for this Owner
Home Financials are based on the most recent Mortgage that was taken out on this home.
Original Mortgage
$201,600
Interest Rate
4.46%
Mortgage Type
New Conventional
Create a Home Valuation Report for This Property
The Home Valuation Report is an in-depth analysis detailing your home's value as well as a comparison with similar homes in the area
Home Values in the Area
Average Home Value in this Area
Purchase History
| Date | Buyer | Sale Price | Title Company |
|---|---|---|---|
| Allen Daniel W | -- | None Available | |
| Allen Daniel W | $289,000 | First American Title | |
| Churchill Joel J | $252,000 | First American |
Source: Public Records
Mortgage History
| Date | Status | Borrower | Loan Amount |
|---|---|---|---|
| Open | Allen Daniel W | $231,200 | |
| Previous Owner | Churchill Joel J | $201,600 |
Source: Public Records
Tax History Compared to Growth
Tax History
| Year | Tax Paid | Tax Assessment Tax Assessment Total Assessment is a certain percentage of the fair market value that is determined by local assessors to be the total taxable value of land and additions on the property. | Land | Improvement |
|---|---|---|---|---|
| 2024 | $3,110 | $306,770 | $56,350 | $250,420 |
| 2023 | $3,091 | $297,840 | $54,710 | $243,130 |
| 2022 | $2,982 | $289,170 | $53,110 | $236,060 |
| 2021 | $2,893 | $280,750 | $51,560 | $229,190 |
| 2020 | $2,814 | $272,580 | $50,060 | $222,520 |
| 2019 | $2,463 | $264,650 | $48,600 | $216,050 |
| 2018 | $2,250 | $242,380 | $47,180 | $195,200 |
| 2017 | $2,453 | $235,330 | $45,810 | $189,520 |
| 2016 | $2,334 | $228,480 | $44,470 | $184,010 |
| 2015 | $2,293 | $221,830 | $43,170 | $178,660 |
| 2014 | $2,209 | $215,370 | $41,920 | $173,450 |
| 2013 | -- | $209,100 | $40,700 | $168,400 |
Source: Public Records
Map
Nearby Homes
- 5305 Kenway Dr
- V/L Marolf Loop Rd
- 4205 Ginkgo Ave
- 4009 Filbert St
- 4004 Elmwood St
- 1110 Meadow Ave
- 4004 Ginkgo Ave
- 8675 Fairview Rd
- 0 Valley View Dr Unit 24275744
- 3607 3rd St
- 0 Alder Ln Unit 24402052
- 3602 Walnut Ln
- 3413 Maple Ln
- 903 Evergreen Dr
- 0 Edelwyss Rd Unit 405 731536279
- 0 Edelwyss Rd Unit TL 405 25-357
- 5240 Sollie Smith Rd N
- 9065 Trask River Rd
- 6505 Colonial Way
- 490 Colonial Ct
- 500 Colonial Ct
- 6405 Colonial Way
- 470 Colonial Ct
- 6420 Colonial Way
- 6440 Colonial Way
- 6400 Colonial Way
- 450 Colonial Ct
- 6460 Colonial Way
- 6480 Colonial Way
- 540 Colonial Ct
- 6550 Colonial Way
- 485 Colonial Ct
- 6500 Colonial Way
- 5311 3rd St
- 5395 3rd St
- 505 Colonial Ct
- 5306 Kenway Dr
- 5405 3rd St