645 Asilo Unit LOT1 Arroyo Grande, CA 93420
Estimated Value: $1,179,000 - $1,401,000
3
Beds
2
Baths
1,900
Sq Ft
$672/Sq Ft
Est. Value
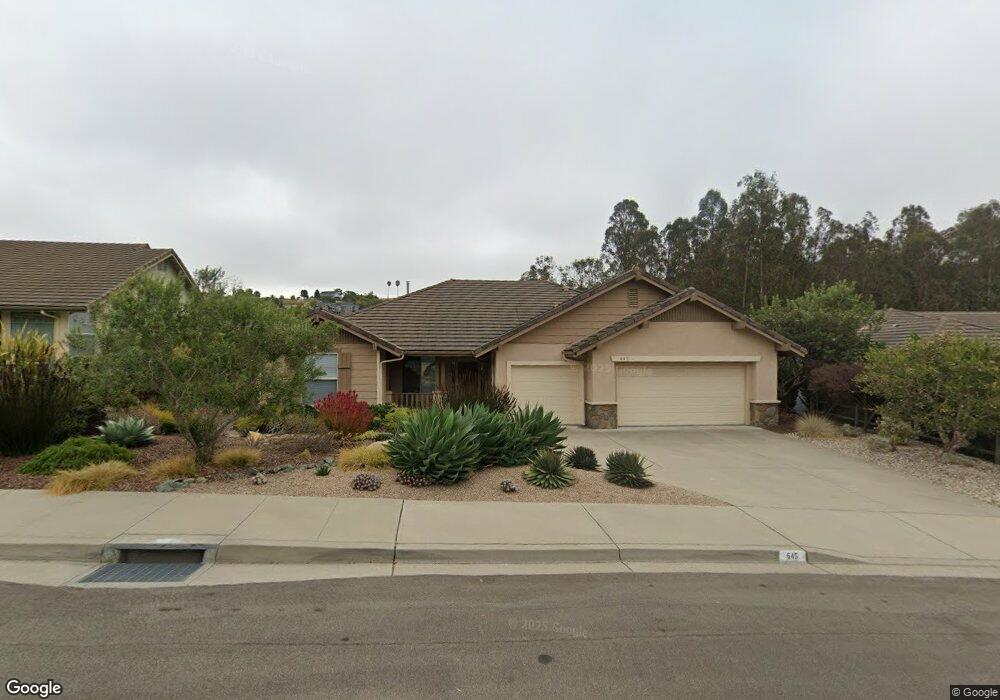
About This Home
This home is located at 645 Asilo Unit LOT1, Arroyo Grande, CA 93420 and is currently estimated at $1,277,429, approximately $672 per square foot. 645 Asilo Unit LOT1 is a home located in San Luis Obispo County with nearby schools including Ocean View Elementary School, Judkins Middle School, and Arroyo Grande High School.
Ownership History
Date
Name
Owned For
Owner Type
Purchase Details
Closed on
Oct 9, 2020
Sold by
Tait Douglas W and Irvine Karen
Bought by
Tait Family Trust and Tait
Current Estimated Value
Purchase Details
Closed on
Jan 3, 2012
Sold by
Tait Douglas W and Tait Karen L Irvine
Bought by
Tait Douglas W and Tait Karen L Irvine
Purchase Details
Closed on
Apr 30, 2010
Sold by
Tait Douglas W and Tait Karen L Irvine
Bought by
Tait Douglas W and Tait Karen L Irvine
Purchase Details
Closed on
Jul 23, 1997
Sold by
Castlerock Development
Bought by
Tait Douglas W and Tait Karen L Irvine
Home Financials for this Owner
Home Financials are based on the most recent Mortgage that was taken out on this home.
Original Mortgage
$192,000
Interest Rate
5.75%
Create a Home Valuation Report for This Property
The Home Valuation Report is an in-depth analysis detailing your home's value as well as a comparison with similar homes in the area
Home Values in the Area
Average Home Value in this Area
Purchase History
| Date | Buyer | Sale Price | Title Company |
|---|---|---|---|
| Tait Family Trust | -- | None Listed On Document | |
| Tait Douglas W | -- | Accommodation | |
| Tait Douglas W | -- | None Available | |
| Tait Douglas W | $256,000 | Chicago Title Co |
Source: Public Records
Mortgage History
| Date | Status | Borrower | Loan Amount |
|---|---|---|---|
| Previous Owner | Tait Douglas W | $192,000 | |
| Closed | Tait Douglas W | $38,400 |
Source: Public Records
Tax History
| Year | Tax Paid | Tax Assessment Tax Assessment Total Assessment is a certain percentage of the fair market value that is determined by local assessors to be the total taxable value of land and additions on the property. | Land | Improvement |
|---|---|---|---|---|
| 2025 | $4,154 | $408,734 | $199,575 | $209,159 |
| 2024 | $4,105 | $400,720 | $195,662 | $205,058 |
| 2023 | $4,105 | $392,864 | $191,826 | $201,038 |
| 2022 | $4,042 | $385,162 | $188,065 | $197,097 |
| 2021 | $4,032 | $377,611 | $184,378 | $193,233 |
| 2020 | $3,986 | $373,740 | $182,488 | $191,252 |
| 2019 | $3,955 | $366,412 | $178,910 | $187,502 |
| 2018 | $3,906 | $359,228 | $175,402 | $183,826 |
| 2017 | $3,840 | $352,185 | $171,963 | $180,222 |
| 2016 | $3,626 | $345,281 | $168,592 | $176,689 |
| 2015 | $3,595 | $340,095 | $166,060 | $174,035 |
| 2014 | $3,463 | $333,434 | $162,808 | $170,626 |
Source: Public Records
Map
Nearby Homes
- 680 Matthew Way
- 515 Windermere Ln
- 917 Printz Rd
- 411 Spanish Moss Ln
- 413 Via Bandolero
- 449 Quail Hill Ln
- 585 Via La Barranca
- 267 Mercedes Ln
- 579 Camino Mercado Unit 215
- 579 Camino Mercado Unit 310
- 579 Camino Mercado Unit 518
- 1009 Meadow Way
- 155 Moore Ln
- 1119 James Way
- 1113 Grieb Dr
- 547 May St
- 1155 Carpenter Canyon Rd
- 350 Corbett Canyon Rd
- 846 Tempus Cir
- 245 Robles Rd
Your Personal Tour Guide
Ask me questions while you tour the home.