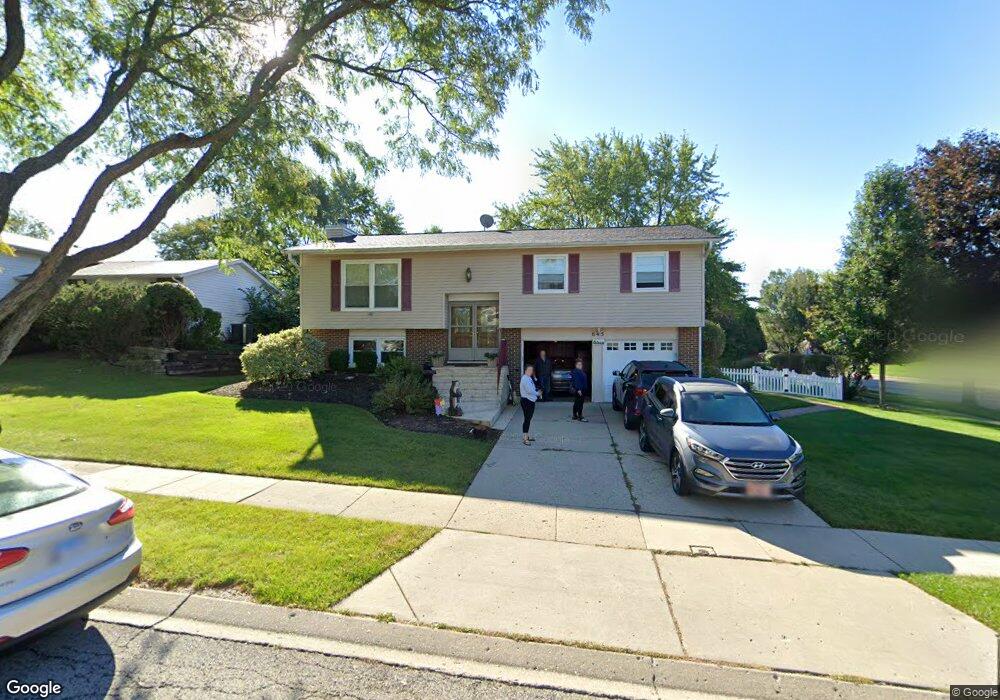
645 Chestnut Ct Algonquin, IL 60102
High Hill Farms NeighborhoodEstimated Value: $367,256 - $395,000
3
Beds
3
Baths
1,258
Sq Ft
$307/Sq Ft
Est. Value
About This Home
This home is located at 645 Chestnut Ct, Algonquin, IL 60102 and is currently estimated at $386,314, approximately $307 per square foot. 645 Chestnut Ct is a home located in McHenry County with nearby schools including Westfield Community School, Kenneth E Neubert Elementary School, and Harry D Jacobs High School.
Ownership History
Date
Name
Owned For
Owner Type
Purchase Details
Closed on
Jun 18, 2007
Sold by
Deplesys Gerald A and Duplesys Eve
Bought by
Cooke Kevin and Cooke Julie
Current Estimated Value
Home Financials for this Owner
Home Financials are based on the most recent Mortgage that was taken out on this home.
Original Mortgage
$256,972
Outstanding Balance
$154,257
Interest Rate
6.2%
Mortgage Type
FHA
Estimated Equity
$232,057
Create a Home Valuation Report for This Property
The Home Valuation Report is an in-depth analysis detailing your home's value as well as a comparison with similar homes in the area
Home Values in the Area
Average Home Value in this Area
Purchase History
| Date | Buyer | Sale Price | Title Company |
|---|---|---|---|
| Cooke Kevin | $266,500 | Heritage Title Company |
Source: Public Records
Mortgage History
| Date | Status | Borrower | Loan Amount |
|---|---|---|---|
| Open | Cooke Kevin | $256,972 |
Source: Public Records
Tax History
| Year | Tax Paid | Tax Assessment Tax Assessment Total Assessment is a certain percentage of the fair market value that is determined by local assessors to be the total taxable value of land and additions on the property. | Land | Improvement |
|---|---|---|---|---|
| 2024 | $7,391 | $102,478 | $23,055 | $79,423 |
| 2023 | $7,003 | $91,654 | $20,620 | $71,034 |
| 2022 | $6,397 | $80,597 | $21,044 | $59,553 |
| 2021 | $6,130 | $75,086 | $19,605 | $55,481 |
| 2020 | $5,965 | $72,428 | $18,911 | $53,517 |
| 2019 | $5,814 | $69,322 | $18,100 | $51,222 |
| 2018 | $5,532 | $64,039 | $16,721 | $47,318 |
| 2017 | $5,310 | $60,329 | $15,752 | $44,577 |
| 2016 | $5,220 | $56,583 | $14,774 | $41,809 |
| 2013 | -- | $54,696 | $13,783 | $40,913 |
Source: Public Records
Map
Nearby Homes
- 615 Harper Dr
- 313 Bayberry Dr
- 21 Division St
- 407 La Fox River Dr
- 108 La Fox Dr
- 909 Roger St
- 1200 Hillside View
- 1354 Essex St Unit 2
- SWC Talaga and Algonquin Rd
- 1431 Essex St
- 0 River Dr N Unit MRD12473279
- 700 Fairfield Ln
- Lot #3-5 Hayes Rd
- 1 Grandview Ct Unit 8
- 935 Viewpoint Dr
- 944 Cynthia Ln
- 298 Apache Trail
- 1002 Interloch Ct Unit 152
- LOT 3 Blackhawk Dr
- 1621 Glengarry Ct Unit 131
- 635 Chestnut Ct
- 632 Orchard Ct
- 622 Orchard Ct
- 705 Chestnut Ct
- 650 Chestnut Ct Unit 1
- 625 Chestnut Ct
- 640 Chestnut Ct
- 702 Orchard Ct
- 612 Orchard Ct
- 700 Chestnut Ct
- 630 Chestnut Ct
- 615 Chestnut Ct
- 715 Chestnut Ct Unit 1
- 712 Orchard Ct
- 661 Butterfield Dr
- 621 Orchard Ct
- 710 Chestnut Ct
- 651 Butterfield Dr
- 620 Chestnut Ct
- 701 Orchard Ct
Your Personal Tour Guide
Ask me questions while you tour the home.