6452 Berrien St Sawyer, MI 49125
Shorewood-Tower Hills-Harbert NeighborhoodEstimated Value: $337,000 - $436,000
2
Beds
1
Bath
739
Sq Ft
$552/Sq Ft
Est. Value
About This Home
This home is located at 6452 Berrien St, Sawyer, MI 49125 and is currently estimated at $407,693, approximately $551 per square foot. 6452 Berrien St is a home located in Berrien County with nearby schools including Chikaming Elementary School, Three Oaks Elementary School, and River Valley Middle/High School.
Ownership History
Date
Name
Owned For
Owner Type
Purchase Details
Closed on
Oct 14, 2019
Sold by
Fraser Karen M
Bought by
Fraser Karen M
Current Estimated Value
Purchase Details
Closed on
Oct 11, 2019
Sold by
Coffeen Michael R
Bought by
Fraser Karen M
Purchase Details
Closed on
Oct 19, 2009
Sold by
Fraser Karen M
Bought by
Coffeen Michael R and Fraser Karen M
Home Financials for this Owner
Home Financials are based on the most recent Mortgage that was taken out on this home.
Original Mortgage
$59,000
Interest Rate
5.07%
Mortgage Type
New Conventional
Purchase Details
Closed on
Oct 17, 2009
Sold by
Fraser Alexander V and Kain Fraser Sylvia E
Bought by
Coffeen Michael R and Fraser Karen M
Home Financials for this Owner
Home Financials are based on the most recent Mortgage that was taken out on this home.
Original Mortgage
$59,000
Interest Rate
5.07%
Mortgage Type
New Conventional
Create a Home Valuation Report for This Property
The Home Valuation Report is an in-depth analysis detailing your home's value as well as a comparison with similar homes in the area
Home Values in the Area
Average Home Value in this Area
Purchase History
| Date | Buyer | Sale Price | Title Company |
|---|---|---|---|
| Fraser Karen M | -- | None Available | |
| Fraser Karen M | -- | None Available | |
| Coffeen Michael R | -- | Multiple | |
| Coffeen Michael R | -- | Multiple |
Source: Public Records
Mortgage History
| Date | Status | Borrower | Loan Amount |
|---|---|---|---|
| Previous Owner | Coffeen Michael R | $59,000 |
Source: Public Records
Tax History Compared to Growth
Tax History
| Year | Tax Paid | Tax Assessment Tax Assessment Total Assessment is a certain percentage of the fair market value that is determined by local assessors to be the total taxable value of land and additions on the property. | Land | Improvement |
|---|---|---|---|---|
| 2025 | $2,669 | $187,000 | $0 | $0 |
| 2024 | $2,304 | $170,900 | $0 | $0 |
| 2023 | $2,195 | $109,800 | $0 | $0 |
| 2022 | $2,091 | $114,100 | $0 | $0 |
| 2021 | $2,286 | $106,700 | $82,000 | $24,700 |
| 2020 | $2,258 | $96,200 | $0 | $0 |
| 2019 | $2,173 | $197,500 | $172,700 | $24,800 |
| 2018 | $2,122 | $197,500 | $0 | $0 |
| 2017 | $2,083 | $197,300 | $0 | $0 |
| 2016 | $1,991 | $207,700 | $0 | $0 |
| 2015 | $1,979 | $212,900 | $0 | $0 |
| 2014 | $1,758 | $217,200 | $0 | $0 |
Source: Public Records
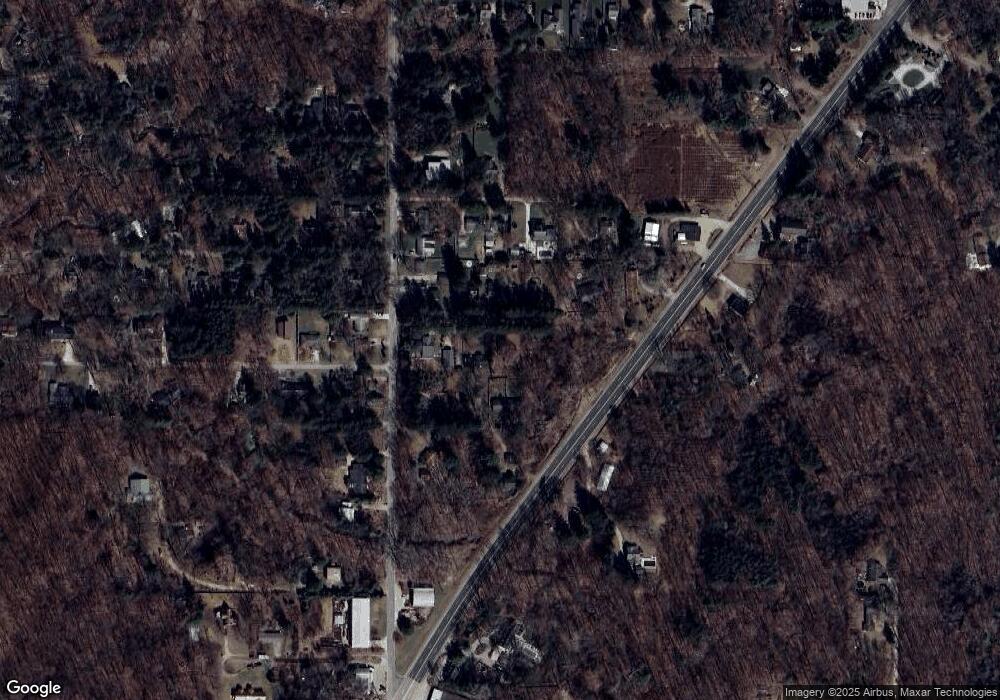
Map
Nearby Homes
- 6490 E Chikaming
- 6265 Elm Dr
- 0 Tower Hill Dr
- 12980 Crestview Dr
- 12370 Dunes Rd
- 6454 Sweetbriar Ct
- 6440 Sweetbriar Ct
- 13025 Red Arrow Hwy
- 6832 Holloway Dr
- 12435 Sandpiper Ln
- 13176 Red Arrow Hwy
- 12856 Flynn Rd
- 5831 Browntown Rd
- 5650 Lily Ln
- ABC Greenbush Ct
- ABC Greenbush Rd
- VL # 1 + 3 S Dune Rd
- VL # 2 S Dune Rd
- VL # 2 + 4 S Dune Rd
- VL # 1 S Dune Rd
- 6464 Berrien St
- 6451 E Chikaming Unit 2
- 6451 E Chikaming Unit 1
- 6451 E Chikaming Unit 1 & 2
- 12670 Red Arrow Hwy
- 0 Berrien St
- 6457 Berrien St
- 6439 Berrien St
- 6475 Berrien St
- 6488 Berrien St
- 6411 Berrien St
- 6489 E Chikaming
- 12766 Red Arrow Hwy
- 12637 Tower Hill Rd
- 12623 Tower Hill Rd
- 12615 Tower Hill Rd
- 12668 Tower Hill Rd
- 6419 E Michigan St
- 12650 Red Arrow Hwy
- 6436 E Michigan St