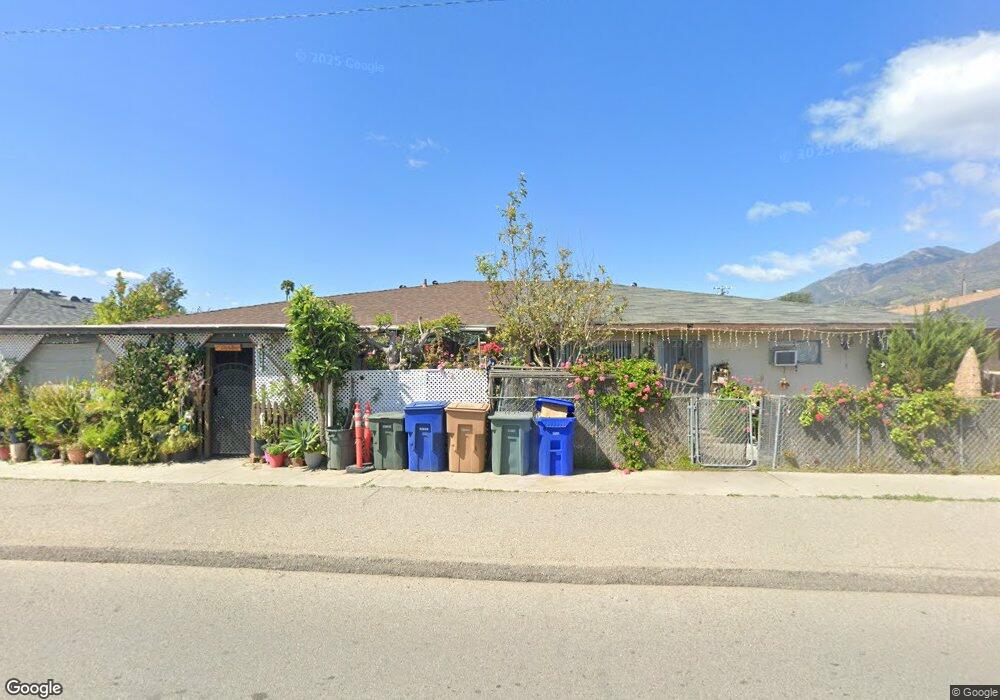
646 Lemon Way Unit 23 Fillmore, CA 93015
Estimated Value: $305,000 - $333,000
2
Beds
1
Bath
702
Sq Ft
$462/Sq Ft
Est. Value
About This Home
This home is located at 646 Lemon Way Unit 23, Fillmore, CA 93015 and is currently estimated at $324,309, approximately $461 per square foot. 646 Lemon Way Unit 23 is a home located in Ventura County with nearby schools including Fillmore Senior High.
Ownership History
Date
Name
Owned For
Owner Type
Purchase Details
Closed on
Nov 30, 2022
Sold by
Valdespino Sylvia
Bought by
Felix Isidro
Current Estimated Value
Home Financials for this Owner
Home Financials are based on the most recent Mortgage that was taken out on this home.
Original Mortgage
$70,000
Interest Rate
6.95%
Mortgage Type
Construction
Purchase Details
Closed on
Oct 15, 2021
Sold by
Felix Martha and The Felix Living Trust
Bought by
Felix Isidro
Home Financials for this Owner
Home Financials are based on the most recent Mortgage that was taken out on this home.
Original Mortgage
$57,000
Interest Rate
2.8%
Mortgage Type
Commercial
Purchase Details
Closed on
Mar 30, 2021
Sold by
Felix Martha and Felix Living Trust
Bought by
Felix Isidro and Isidro Felix Trust
Purchase Details
Closed on
Jun 20, 2017
Sold by
Fellx Isidro N
Bought by
Navarro Isidro Felix
Create a Home Valuation Report for This Property
The Home Valuation Report is an in-depth analysis detailing your home's value as well as a comparison with similar homes in the area
Home Values in the Area
Average Home Value in this Area
Purchase History
| Date | Buyer | Sale Price | Title Company |
|---|---|---|---|
| Felix Isidro | -- | Fidelity National Title | |
| Felix Isidro | $57,000 | Timios Title A Ca Corp | |
| Felix Isidro | -- | None Available | |
| Navarro Isidro Felix | -- | None Available |
Source: Public Records
Mortgage History
| Date | Status | Borrower | Loan Amount |
|---|---|---|---|
| Closed | Felix Isidro | $70,000 | |
| Previous Owner | Felix Isidro | $57,000 |
Source: Public Records
Tax History Compared to Growth
Tax History
| Year | Tax Paid | Tax Assessment Tax Assessment Total Assessment is a certain percentage of the fair market value that is determined by local assessors to be the total taxable value of land and additions on the property. | Land | Improvement |
|---|---|---|---|---|
| 2025 | $3,187 | $286,844 | $186,179 | $100,665 |
| 2024 | $3,187 | $281,220 | $182,528 | $98,692 |
| 2023 | $3,144 | $275,706 | $178,949 | $96,757 |
| 2022 | $2,907 | $270,300 | $175,440 | $94,860 |
| 2021 | $888 | $68,272 | $23,884 | $44,388 |
| 2020 | $826 | $67,574 | $23,640 | $43,934 |
| 2019 | $828 | $66,250 | $23,177 | $43,073 |
| 2018 | $812 | $64,952 | $22,723 | $42,229 |
| 2017 | $734 | $63,679 | $22,278 | $41,401 |
| 2016 | $681 | $62,432 | $21,842 | $40,590 |
| 2015 | $660 | $61,496 | $21,515 | $39,981 |
| 2014 | $659 | $60,294 | $21,095 | $39,199 |
Source: Public Records
Map
Nearby Homes
- 600 C St
- 954 Taylor Ln
- 1050 King St
- 809 Woodgrove Rd
- 569 Kensington Dr
- 300 C St
- 313 C St
- 555 Kensington Dr
- 1262 Sespe Ave
- 320 D St
- 404 Central Ave
- 0 Fillmore St
- 340 Central Ave
- 330 Buttercup St
- 863 Santa fe St
- 639 Mountain View St
- 89 Willow St
- 513 Heritage Valley Pkwy
- 81 Wildwood Ln
- 1560 Goodenough Rd
- 646 Lemon Way
- 646 Lemon Way Unit 5
- 646 Lemon Way Unit 14
- 646 Lemon Way Unit 3
- 646 Lemon Way Unit 1
- 646 Lemon Way Unit 25
- 646 Lemon Way Unit 20
- 646 Lemon Way Unit 27
- 646 Lemon Way Unit 24
- 646 Lemon Way Unit 22
- 646 Lemon Way Unit 18
- 646 Lemon Way Unit 15
- 646 Lemon Way Unit 11
- 646 Lemon Way Unit 8
- 646 Lemon Way Unit 7
- 646 Lemon Way Unit 2
- 646 Lemon Way Unit 28
- 646 Lemon Way Unit 26
- 646 Lemon Way Unit 21
- 646 Lemon Way Unit 19