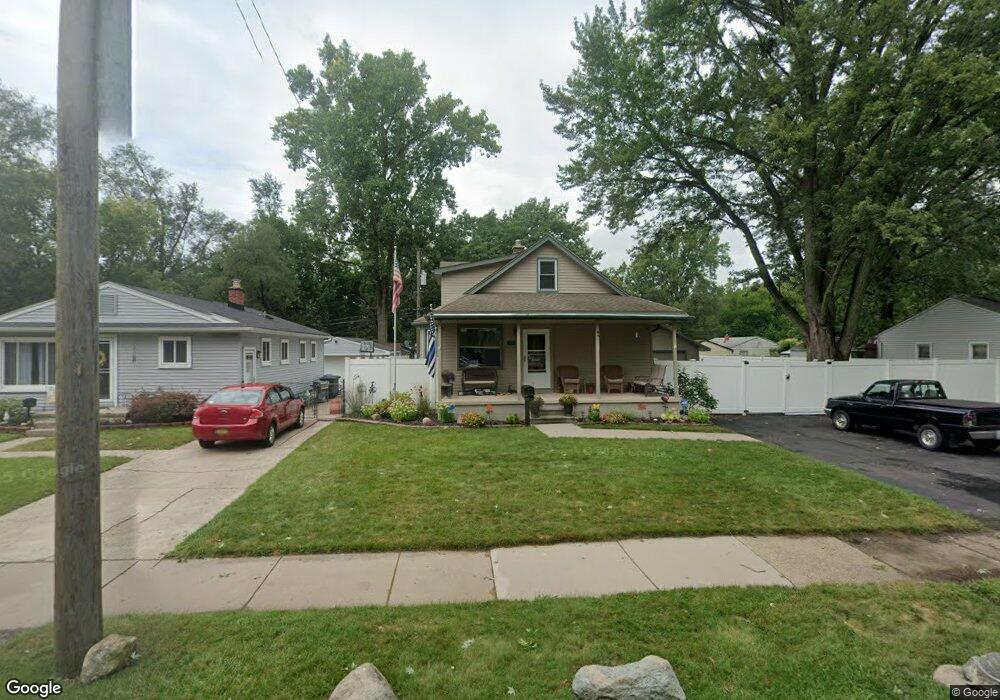
6466 Elm St Taylor, MI 48180
Estimated Value: $177,000 - $245,000
Studio
--
Bath
1,656
Sq Ft
$127/Sq Ft
Est. Value
About This Home
This home is located at 6466 Elm St, Taylor, MI 48180 and is currently estimated at $210,205, approximately $126 per square foot. 6466 Elm St is a home located in Wayne County with nearby schools including Clarence Randall Elementary School, Hoover Middle School, and Quest Charter Academy.
Ownership History
Date
Name
Owned For
Owner Type
Purchase Details
Closed on
May 29, 2024
Sold by
Bersano Gregory A
Bought by
Bersano Gregory A and Grimm Noelle E
Current Estimated Value
Purchase Details
Closed on
Jan 20, 2006
Sold by
Bersano Cynthia J
Bought by
Bersano Gregory A
Home Financials for this Owner
Home Financials are based on the most recent Mortgage that was taken out on this home.
Original Mortgage
$143,100
Interest Rate
6.34%
Mortgage Type
Fannie Mae Freddie Mac
Create a Home Valuation Report for This Property
The Home Valuation Report is an in-depth analysis detailing your home's value as well as a comparison with similar homes in the area
Home Values in the Area
Average Home Value in this Area
Purchase History
| Date | Buyer | Sale Price | Title Company |
|---|---|---|---|
| Bersano Gregory A | -- | None Listed On Document | |
| Bersano Gregory A | -- | First American Title Ins Co |
Source: Public Records
Mortgage History
| Date | Status | Borrower | Loan Amount |
|---|---|---|---|
| Previous Owner | Bersano Gregory A | $143,100 |
Source: Public Records
Tax History
| Year | Tax Paid | Tax Assessment Tax Assessment Total Assessment is a certain percentage of the fair market value that is determined by local assessors to be the total taxable value of land and additions on the property. | Land | Improvement |
|---|---|---|---|---|
| 2025 | $2,261 | $116,200 | $0 | $0 |
| 2024 | $2,101 | $99,700 | $0 | $0 |
| 2023 | $2,005 | $88,200 | $0 | $0 |
| 2022 | $2,005 | $86,600 | $0 | $0 |
| 2021 | $2,202 | $78,200 | $0 | $0 |
| 2020 | $2,180 | $69,000 | $0 | $0 |
| 2019 | $218,029 | $56,300 | $0 | $0 |
| 2018 | $1,722 | $50,400 | $0 | $0 |
| 2017 | $923 | $50,500 | $0 | $0 |
| 2016 | $2,122 | $49,200 | $0 | $0 |
| 2015 | $3,890 | $38,900 | $0 | $0 |
| 2013 | $3,900 | $40,800 | $0 | $0 |
| 2012 | $1,707 | $40,100 | $6,400 | $33,700 |
Source: Public Records
Map
Nearby Homes
- 6456 Birch St
- 6474 Birch St
- 6512 Syracuse St
- 6753 Madison St
- 6606 Cornell St
- 6453 W Point St
- 7140 Elm St
- 6430 Banner St
- 6037 Cooper St
- 6550 Buck St
- 6042 Banner St
- 5689 Cornell St
- 5952 Banner St
- 6420 Burr St
- 5871 Banner St
- 5843 Banner St
- 6605 Bailey St
- 000 Hanover St
- 22823 N Brookside Dr
- 6055 Bailey St
Your Personal Tour Guide
Ask me questions while you tour the home.