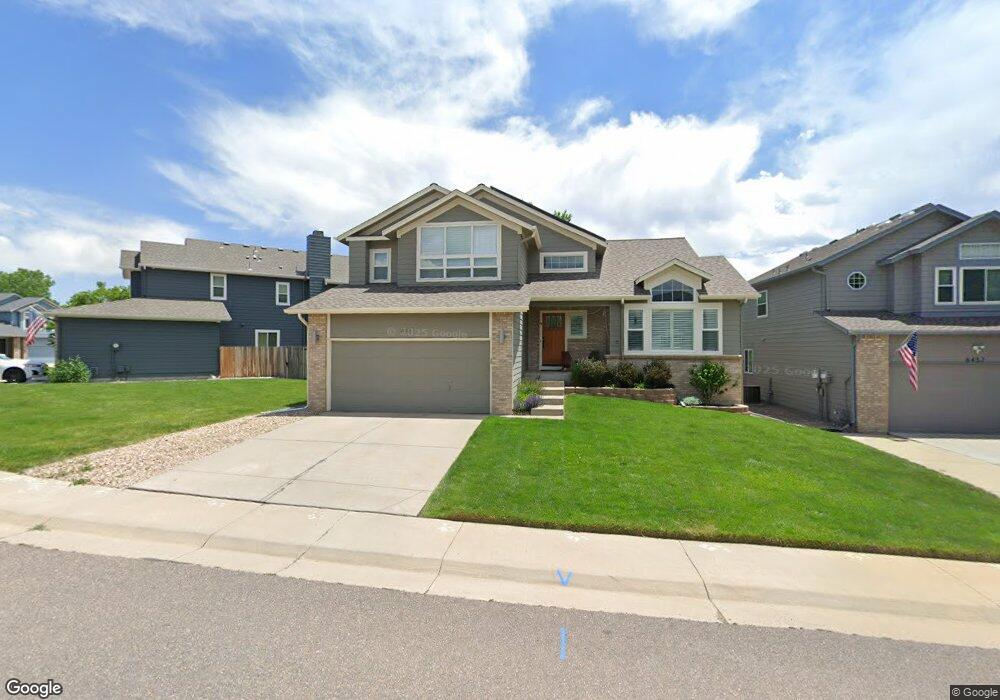
6467 S Xenon St Littleton, CO 80127
Summit Ridge at West Meadows NeighborhoodEstimated Value: $742,000 - $802,000
3
Beds
3
Baths
2,288
Sq Ft
$338/Sq Ft
Est. Value
About This Home
This home is located at 6467 S Xenon St, Littleton, CO 80127 and is currently estimated at $772,436, approximately $337 per square foot. 6467 S Xenon St is a home located in Jefferson County with nearby schools including Powderhorn Elementary School, Summit Ridge Middle School, and Dakota Ridge Senior High School.
Ownership History
Date
Name
Owned For
Owner Type
Purchase Details
Closed on
Mar 16, 2022
Sold by
Caulfield Kevin P
Bought by
Hyde Josie and Loyd David
Current Estimated Value
Home Financials for this Owner
Home Financials are based on the most recent Mortgage that was taken out on this home.
Original Mortgage
$526,500
Outstanding Balance
$491,531
Interest Rate
3.85%
Mortgage Type
Balloon
Estimated Equity
$280,905
Purchase Details
Closed on
Jul 25, 1996
Sold by
Cooper Stephen M and Cooper Elizabeth A
Bought by
Caufield Kevin P
Home Financials for this Owner
Home Financials are based on the most recent Mortgage that was taken out on this home.
Original Mortgage
$148,000
Interest Rate
8.41%
Mortgage Type
Balloon
Purchase Details
Closed on
May 31, 1994
Sold by
Gritz Mark R and Gritz Patricia S
Bought by
Cooper Stephen M and Omer Elizabeth A
Home Financials for this Owner
Home Financials are based on the most recent Mortgage that was taken out on this home.
Original Mortgage
$139,900
Interest Rate
8.75%
Create a Home Valuation Report for This Property
The Home Valuation Report is an in-depth analysis detailing your home's value as well as a comparison with similar homes in the area
Home Values in the Area
Average Home Value in this Area
Purchase History
| Date | Buyer | Sale Price | Title Company |
|---|---|---|---|
| Hyde Josie | $810,000 | None Listed On Document | |
| Caufield Kevin P | $185,000 | Land Title | |
| Cooper Stephen M | $174,900 | -- |
Source: Public Records
Mortgage History
| Date | Status | Borrower | Loan Amount |
|---|---|---|---|
| Open | Hyde Josie | $526,500 | |
| Previous Owner | Caufield Kevin P | $148,000 | |
| Previous Owner | Cooper Stephen M | $139,900 |
Source: Public Records
Tax History Compared to Growth
Tax History
| Year | Tax Paid | Tax Assessment Tax Assessment Total Assessment is a certain percentage of the fair market value that is determined by local assessors to be the total taxable value of land and additions on the property. | Land | Improvement |
|---|---|---|---|---|
| 2024 | $4,312 | $42,097 | $9,590 | $32,507 |
| 2023 | $4,312 | $42,097 | $9,590 | $32,507 |
| 2022 | $3,237 | $31,049 | $8,625 | $22,424 |
| 2021 | $3,281 | $31,943 | $8,873 | $23,070 |
| 2020 | $2,886 | $28,166 | $6,717 | $21,449 |
| 2019 | $2,852 | $28,166 | $6,717 | $21,449 |
| 2018 | $2,829 | $27,026 | $6,769 | $20,257 |
| 2017 | $2,593 | $27,026 | $6,769 | $20,257 |
| 2016 | $2,775 | $27,951 | $7,860 | $20,091 |
| 2015 | $2,449 | $27,951 | $7,860 | $20,091 |
| 2014 | $2,449 | $23,201 | $6,190 | $17,011 |
Source: Public Records
Map
Nearby Homes
- 6430 S Youngfield Ct
- 12118 W Cooper Dr
- 11632 W Quarles Ave
- 12837 W Burgundy Place
- 12792 W Roxbury Place
- 12319 W Burgundy Ave
- 6615 S Robb Ln
- 12713 W Bowles Place
- 7125 S Youngfield Way
- 5995 S Taft Way
- Milner Plan at Ken-Caryl Ranch - Vistas Collection
- Eldora Plan at Ken-Caryl Ranch - Vistas Collection
- Yorke Plan at Ken-Caryl Ranch - Overlook Collection
- Bowery Plan at Ken-Caryl Ranch - Overlook Collection
- Valdez Plan at Ken-Caryl Ranch - Overlook Collection
- Haswell Plan at Ken-Caryl Ranch - Vistas Collection
- Platte Plan at Ken-Caryl Ranch - Vistas Collection
- Calhan Plan at Ken-Caryl Ranch - Overlook Collection
- Hillrose Plan at Ken-Caryl Ranch - Overlook Collection
- Byers Plan at Ken-Caryl Ranch - Vistas Collection
- 6457 S Xenon St
- 6497 S Xenon St
- 6512 S Xenophon St
- 6507 S Xenon St
- 6518 S Xenophon St
- 6488 S Xenophon St
- 6517 S Xenon St
- 6466 S Xenon St
- 6470 S Xenon St
- 6509 S Xenophon St
- 6486 S Xenon St
- 6528 S Xenophon St
- 6519 S Xenophon St
- 6527 S Xenon St
- 6490 S Xenon St
- 6478 S Xenophon St
- 6523 S Xenophon St
- 6496 S Xenon St
- 6489 S Xenophon St
- 6500 S Xenon St