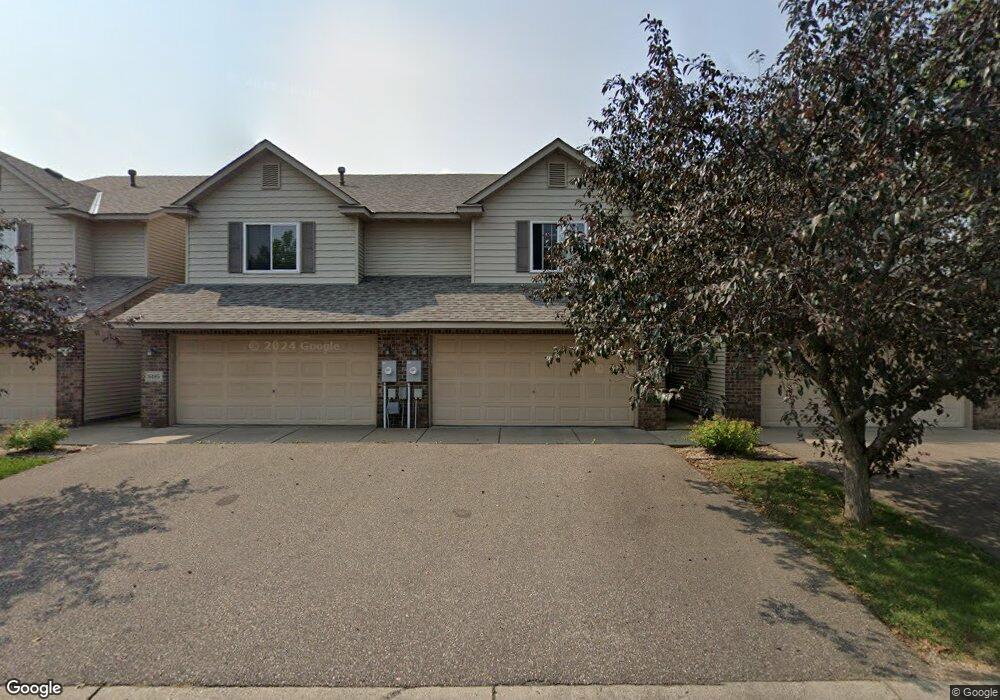
6483 Lower 35th St N Saint Paul, MN 55128
Estimated Value: $239,000 - $281,000
3
Beds
3
Baths
1,800
Sq Ft
$148/Sq Ft
Est. Value
About This Home
This home is located at 6483 Lower 35th St N, Saint Paul, MN 55128 and is currently estimated at $266,659, approximately $148 per square foot. 6483 Lower 35th St N is a home located in Washington County with nearby schools including Cowern Elementary School, Justice Alan Page Elementary, and John Glenn Middle School.
Ownership History
Date
Name
Owned For
Owner Type
Purchase Details
Closed on
Sep 11, 2015
Sold by
Allen Adetola O and Allen Temitope
Bought by
Abodunde Abosede
Current Estimated Value
Purchase Details
Closed on
Jun 2, 2015
Sold by
Fannie Mae
Bought by
Allen Adetola O
Home Financials for this Owner
Home Financials are based on the most recent Mortgage that was taken out on this home.
Original Mortgage
$123,405
Interest Rate
3.65%
Mortgage Type
New Conventional
Purchase Details
Closed on
Oct 17, 2014
Sold by
Everbank
Bought by
Federal National Mortgage Association
Purchase Details
Closed on
Jun 25, 2014
Sold by
Campos Ty A and Campos Miklyn C
Bought by
Everbank
Purchase Details
Closed on
Mar 8, 2002
Sold by
Mw Johnson Construction
Bought by
Campos Miklyn C and Campos Ty A
Create a Home Valuation Report for This Property
The Home Valuation Report is an in-depth analysis detailing your home's value as well as a comparison with similar homes in the area
Home Values in the Area
Average Home Value in this Area
Purchase History
| Date | Buyer | Sale Price | Title Company |
|---|---|---|---|
| Abodunde Abosede | -- | None Available | |
| Allen Adetola O | -- | First Fincl Title Agency Of | |
| Federal National Mortgage Association | -- | None Available | |
| Everbank | $166,802 | None Available | |
| Campos Miklyn C | $175,640 | -- |
Source: Public Records
Mortgage History
| Date | Status | Borrower | Loan Amount |
|---|---|---|---|
| Previous Owner | Allen Adetola O | $123,405 |
Source: Public Records
Tax History Compared to Growth
Tax History
| Year | Tax Paid | Tax Assessment Tax Assessment Total Assessment is a certain percentage of the fair market value that is determined by local assessors to be the total taxable value of land and additions on the property. | Land | Improvement |
|---|---|---|---|---|
| 2024 | $2,662 | $246,600 | $50,000 | $196,600 |
| 2023 | $2,662 | $255,200 | $65,000 | $190,200 |
| 2022 | $2,396 | $238,600 | $62,100 | $176,500 |
| 2021 | $2,442 | $211,400 | $55,000 | $156,400 |
| 2020 | $2,138 | $214,000 | $64,000 | $150,000 |
| 2019 | $1,964 | $187,900 | $37,500 | $150,400 |
| 2018 | $1,928 | $175,200 | $37,500 | $137,700 |
| 2017 | $1,908 | $163,500 | $32,000 | $131,500 |
| 2016 | $1,806 | $154,200 | $25,000 | $129,200 |
| 2015 | -- | $128,100 | $20,300 | $107,800 |
| 2013 | -- | $111,800 | $18,900 | $92,900 |
Source: Public Records
Map
Nearby Homes
- 3592 Garden Blvd N
- 3597 Gershwin Ct N
- 6920 35th St N
- 3838 Goodwin Ave N
- 6963 Upper 35th Street Cir N
- 3740 Gershwin Ave N
- 3742 Gershwin Ave N
- 3590 Genevieve Ave N
- 3598 Gershwin Ln N
- 6591 30th Street Ct N
- 6639 Gretchen Ln N
- 3945 Gershwin Ave N
- 6631 Gretchen Ln N
- 3708 Gershwin Ln N
- 3662 Gershwin Ln N
- 2590 Glenbrook Ave N
- 2521 Cowern Place E
- 2568 South Ave E
- 6671 Stillwater Blvd N
- 2477 Grenadier Ave N
- 6485 Lower 35th St N
- 6481 Lower 35th St N
- 6487 Lower 35th St N
- 3504 Grafton Ave N
- 3506 Grafton Ave N
- 6484 Lower 35th St N
- 3502 Grafton Ave N
- 6486 Lower 35th St N
- 6488 Lower 35th St N
- 3521 Grafton Ave N
- 3523 Grafton Ave N
- 3503 Goodwin Ave N
- 3505 Goodwin Ave N
- 3501 Goodwin Ave N
- 6465 35th St N
- 3525 Grafton Ave N
- 3509 Goodwin Ave N
- 6463 35th St N
- 6461 35th St N
- 6468 35th St N