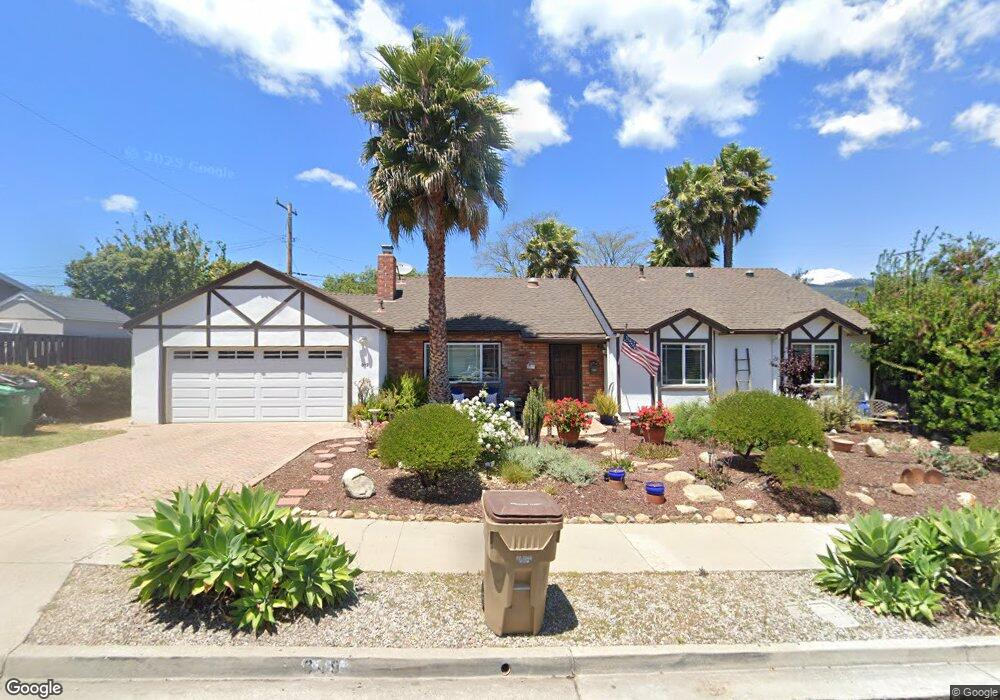
649 Camino Campana Santa Barbara, CA 93111
East Goleta Valley NeighborhoodEstimated Value: $1,694,000 - $1,981,000
3
Beds
2
Baths
1,979
Sq Ft
$917/Sq Ft
Est. Value
About This Home
This home is located at 649 Camino Campana, Santa Barbara, CA 93111 and is currently estimated at $1,813,970, approximately $916 per square foot. 649 Camino Campana is a home located in Santa Barbara County with nearby schools including Kellogg Elementary School, Goleta Valley Junior High School, and Dos Pueblos Senior High School.
Ownership History
Date
Name
Owned For
Owner Type
Purchase Details
Closed on
Mar 18, 2010
Sold by
Mckittrick James E and Mckittrick Mehle Lee
Bought by
Wada Takashi Michael and Ochoa Cecilia
Current Estimated Value
Home Financials for this Owner
Home Financials are based on the most recent Mortgage that was taken out on this home.
Original Mortgage
$620,000
Outstanding Balance
$408,865
Interest Rate
4.88%
Mortgage Type
New Conventional
Estimated Equity
$1,405,105
Purchase Details
Closed on
Jan 27, 2005
Sold by
Mckittrick James E and Mckittrick Mehle Lee
Bought by
Mckittrick James E and Mckittrick Mehle Lee
Purchase Details
Closed on
Feb 19, 2004
Sold by
Mckittkic James E and Mckittrick Mehle L
Bought by
Mckittrick James E and Mckittrick Mehle L
Purchase Details
Closed on
Aug 29, 1991
Sold by
Hulbert Mehle L
Bought by
Mckittrick James E and Mckittrick Mehle Lee
Create a Home Valuation Report for This Property
The Home Valuation Report is an in-depth analysis detailing your home's value as well as a comparison with similar homes in the area
Home Values in the Area
Average Home Value in this Area
Purchase History
| Date | Buyer | Sale Price | Title Company |
|---|---|---|---|
| Wada Takashi Michael | $775,000 | Fidelity National Title Co | |
| Mckittrick James E | -- | -- | |
| Mckittrick James E | -- | -- | |
| Mckittrick James E | -- | -- | |
| Mckittrick James E | -- | -- |
Source: Public Records
Mortgage History
| Date | Status | Borrower | Loan Amount |
|---|---|---|---|
| Open | Wada Takashi Michael | $620,000 |
Source: Public Records
Tax History Compared to Growth
Tax History
| Year | Tax Paid | Tax Assessment Tax Assessment Total Assessment is a certain percentage of the fair market value that is determined by local assessors to be the total taxable value of land and additions on the property. | Land | Improvement |
|---|---|---|---|---|
| 2025 | $11,944 | $1,100,859 | $645,406 | $455,453 |
| 2023 | $11,944 | $1,058,113 | $620,345 | $437,768 |
| 2022 | $11,564 | $1,037,367 | $608,182 | $429,185 |
| 2021 | $11,377 | $1,017,027 | $596,257 | $420,770 |
| 2020 | $11,082 | $1,006,600 | $590,144 | $416,456 |
| 2019 | $10,884 | $986,864 | $578,573 | $408,291 |
| 2018 | $10,666 | $967,515 | $567,229 | $400,286 |
| 2017 | $10,483 | $948,545 | $556,107 | $392,438 |
| 2016 | $10,171 | $929,947 | $545,203 | $384,744 |
| 2014 | $9,935 | $898,037 | $526,495 | $371,542 |
Source: Public Records
Map
Nearby Homes
- 711 Dorado Dr
- 5710 Stow Canyon Rd
- 777 Avenida Pequena
- 556 Noel Ct
- 554 Noel Ct
- 5648 Berkeley Rd
- 5366 Paseo Orlando
- 5745 Berkeley Rd
- 5325 Traci Dr
- 313 Moreton Bay Ln Unit 1
- 267 Moreton Bay Ln Unit 2
- 5310 Orchard Park Ln
- 00 N Fairview Ave
- 5964 Berkeley Rd
- 243 Moreton Bay Ln Unit 2
- 0 N Fairview Ave Unit SR24087795
- 1500 Camino Meleno
- 31 Dearborn Place Unit 36
- 5190 Kara Dr
- 41 Dearborn Place Unit 77
- 643 Camino Campana
- 651 Camino Campana
- 5569 Cathedral Oaks Rd
- 5565 Cathedral Oaks Rd
- 5565 Cathedral Oaks Rd Unit 1
- 648 Camino Campana
- 655 Camino Campana
- 639 Camino Campana
- 5575 Cathedral Oaks Rd
- 650 Camino Campana
- 5560 Campana Ct
- 5561 Cathedral Oaks Rd
- 654 Camino Campana
- 659 Camino Campana
- 5561 Campana Ct
- 5550 Campana Ct
- 635 Camino Campana
- 5566 Cathedral Oaks Rd
- 5581 Cathedral Oaks Rd
- 5537 Capellina Way