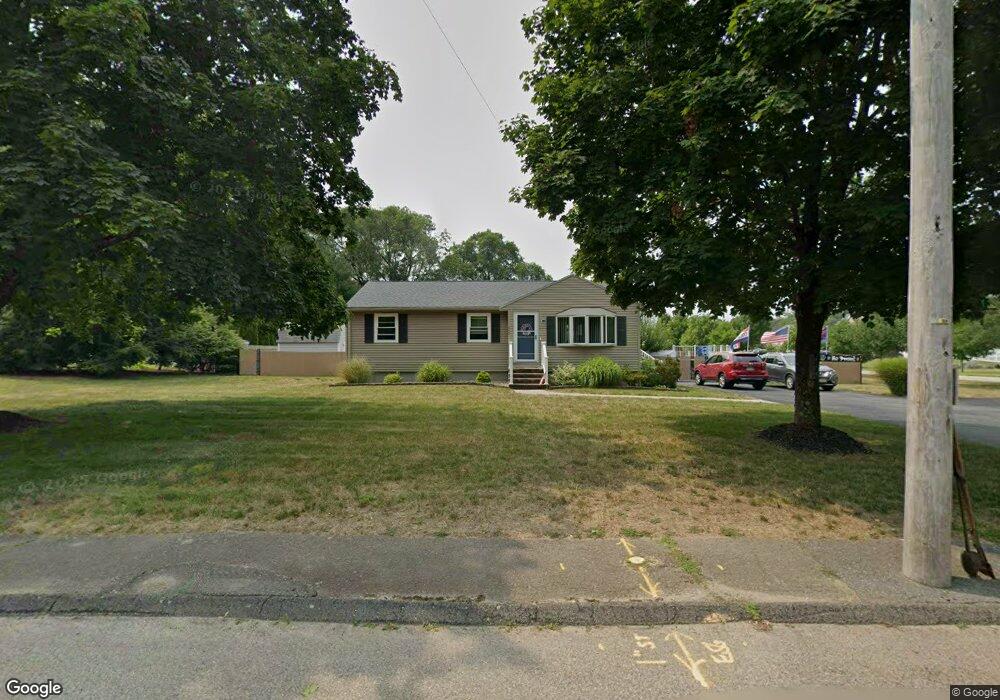
649 Elm St Mansfield, MA 02048
Estimated Value: $513,000 - $597,000
3
Beds
1
Bath
994
Sq Ft
$546/Sq Ft
Est. Value
About This Home
This home is located at 649 Elm St, Mansfield, MA 02048 and is currently estimated at $543,136, approximately $546 per square foot. 649 Elm St is a home located in Bristol County with nearby schools including Everett W. Robinson Elementary School, Jordan/Jackson Elementary School, and Harold L. Qualters Middle School.
Ownership History
Date
Name
Owned For
Owner Type
Purchase Details
Closed on
Feb 23, 2022
Sold by
Marsh Robert S
Bought by
Germano Linda A and Marsh Robert S
Current Estimated Value
Purchase Details
Closed on
Jul 20, 2005
Sold by
Mcpherson Patrick R and Mcpherson Alonzo Ruth
Bought by
Marsh Robert S
Home Financials for this Owner
Home Financials are based on the most recent Mortgage that was taken out on this home.
Original Mortgage
$100,000
Interest Rate
5.59%
Mortgage Type
Purchase Money Mortgage
Create a Home Valuation Report for This Property
The Home Valuation Report is an in-depth analysis detailing your home's value as well as a comparison with similar homes in the area
Home Values in the Area
Average Home Value in this Area
Purchase History
| Date | Buyer | Sale Price | Title Company |
|---|---|---|---|
| Germano Linda A | -- | None Available | |
| Marsh Robert S | $345,000 | -- |
Source: Public Records
Mortgage History
| Date | Status | Borrower | Loan Amount |
|---|---|---|---|
| Previous Owner | Marsh Robert S | $100,000 |
Source: Public Records
Tax History Compared to Growth
Tax History
| Year | Tax Paid | Tax Assessment Tax Assessment Total Assessment is a certain percentage of the fair market value that is determined by local assessors to be the total taxable value of land and additions on the property. | Land | Improvement |
|---|---|---|---|---|
| 2025 | $5,986 | $454,500 | $241,800 | $212,700 |
| 2024 | $5,643 | $418,000 | $241,800 | $176,200 |
| 2023 | $5,574 | $395,600 | $241,800 | $153,800 |
| 2022 | $5,408 | $356,500 | $223,800 | $132,700 |
| 2021 | $5,190 | $337,900 | $195,900 | $142,000 |
| 2020 | $4,983 | $324,400 | $186,600 | $137,800 |
| 2019 | $4,569 | $300,200 | $155,400 | $144,800 |
| 2018 | $4,220 | $276,000 | $148,200 | $127,800 |
| 2017 | $4,189 | $278,900 | $144,000 | $134,900 |
| 2016 | $4,127 | $267,800 | $137,100 | $130,700 |
| 2015 | $3,821 | $246,500 | $137,100 | $109,400 |
Source: Public Records
Map
Nearby Homes
- 37 Oakleaf Dr
- 2 Oak St Unit 2D
- 2 Oak St Unit 2A
- 2 Oak St Unit 2C
- 2 Oak St Unit 2B
- 176 Elm St
- 451R Gilbert St
- 14 Country Club Way
- 150 Gilbert St
- 255 Mckeon Dr
- 250 Mansfield Ave Unit 66
- 4 Village Way Unit F
- 4 Buckskin Dr
- 157 Mansfield Ave Unit 14
- 15 Reservoir St Unit 44
- 19 Precourt Ln
- 933 Pleasant St
- 18 Columbine Rd
- 16 Park Ln
- 136 Lindsey St