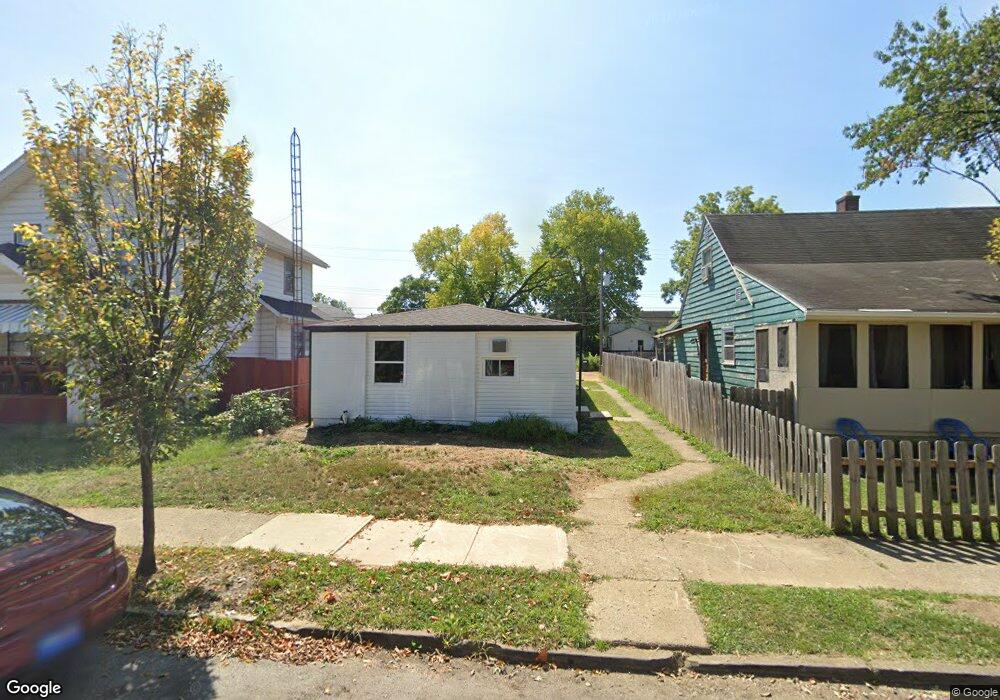
649 Hanford St Unit 651 Columbus, OH 43206
Karns Park NeighborhoodEstimated Value: $185,000 - $222,000
4
Beds
2
Baths
1,311
Sq Ft
$160/Sq Ft
Est. Value
About This Home
This home is located at 649 Hanford St Unit 651, Columbus, OH 43206 and is currently estimated at $209,911, approximately $160 per square foot. 649 Hanford St Unit 651 is a home located in Franklin County with nearby schools including Lincoln Park Elementary School, South High School, and South Columbus Preparatory Academy.
Ownership History
Date
Name
Owned For
Owner Type
Purchase Details
Closed on
Jul 16, 2025
Sold by
Eks Services Llc
Bought by
Knowles Emma
Current Estimated Value
Home Financials for this Owner
Home Financials are based on the most recent Mortgage that was taken out on this home.
Original Mortgage
$210,927
Outstanding Balance
$210,557
Interest Rate
6.67%
Mortgage Type
FHA
Estimated Equity
-$646
Purchase Details
Closed on
Feb 21, 2025
Sold by
Moore Revocable Living Trust and Moore James R
Bought by
Eks Services Llc
Home Financials for this Owner
Home Financials are based on the most recent Mortgage that was taken out on this home.
Original Mortgage
$165,000
Interest Rate
6.93%
Mortgage Type
New Conventional
Purchase Details
Closed on
Feb 2, 2010
Sold by
Moore Candi L and Moore James R
Bought by
Moore James R and Moore Candi L
Purchase Details
Closed on
Jan 2, 1980
Bought by
Moore Candi
Create a Home Valuation Report for This Property
The Home Valuation Report is an in-depth analysis detailing your home's value as well as a comparison with similar homes in the area
Home Values in the Area
Average Home Value in this Area
Purchase History
| Date | Buyer | Sale Price | Title Company |
|---|---|---|---|
| Knowles Emma | $215,000 | Fortis Title | |
| Eks Services Llc | $157,000 | Empora Title | |
| Moore James R | -- | Attorney | |
| Moore Candi | $5,000 | -- |
Source: Public Records
Mortgage History
| Date | Status | Borrower | Loan Amount |
|---|---|---|---|
| Open | Knowles Emma | $210,927 | |
| Previous Owner | Eks Services Llc | $165,000 |
Source: Public Records
Tax History Compared to Growth
Tax History
| Year | Tax Paid | Tax Assessment Tax Assessment Total Assessment is a certain percentage of the fair market value that is determined by local assessors to be the total taxable value of land and additions on the property. | Land | Improvement |
|---|---|---|---|---|
| 2024 | $2,671 | $58,280 | $21,320 | $36,960 |
| 2023 | $2,638 | $58,275 | $21,315 | $36,960 |
| 2022 | $969 | $18,240 | $4,730 | $13,510 |
| 2021 | $971 | $18,240 | $4,730 | $13,510 |
| 2020 | $973 | $18,240 | $4,730 | $13,510 |
| 2019 | $947 | $15,230 | $3,960 | $11,270 |
| 2018 | $1,173 | $15,230 | $3,960 | $11,270 |
| 2017 | $947 | $15,230 | $3,960 | $11,270 |
| 2016 | $1,539 | $22,650 | $3,680 | $18,970 |
| 2015 | $1,401 | $22,650 | $3,680 | $18,970 |
| 2014 | $1,404 | $22,650 | $3,680 | $18,970 |
| 2013 | $730 | $23,870 | $3,885 | $19,985 |
Source: Public Records
Map
Nearby Homes
- 706 Frebis Ave
- 621-627 E Gates St
- 676 E Moler St
- 609 Frebis Ave
- 721 Hanford St Unit 721-723
- 605 Frebis Ave
- 601 Frebis Ave
- 656 Sheldon Ave
- 554 Hanford St
- 563 Frebis Ave
- 735-737 E Mithoff St
- 650 E Mithoff St
- 546 Frebis Ave
- 0 Gilbert St
- 523 Hanford St
- 1263 Heyl Ave
- 693 Thurman Ave
- 565 E Mithoff St
- 1240 S 17th St
- 530 E Moler St
- 655 Hanford St
- 647 Hanford St
- 659 Hanford St Unit 661
- 659-661 Hanford St
- 661 Hanford St
- 665 Hanford St
- 670 Frebis Ave
- 674 Frebis Ave
- 664 Frebis Ave
- 667 Hanford St Unit 669
- 667-669 Hanford St Unit 69
- 667-669 Hanford St
- 680 Frebis Ave
- 629 Hanford St
- 629 Hanford St
- 629 Hanford St
- 642-644 Hanford St
- 1384 S 18th St
- 658 Frebis Ave
- 652 Hanford St