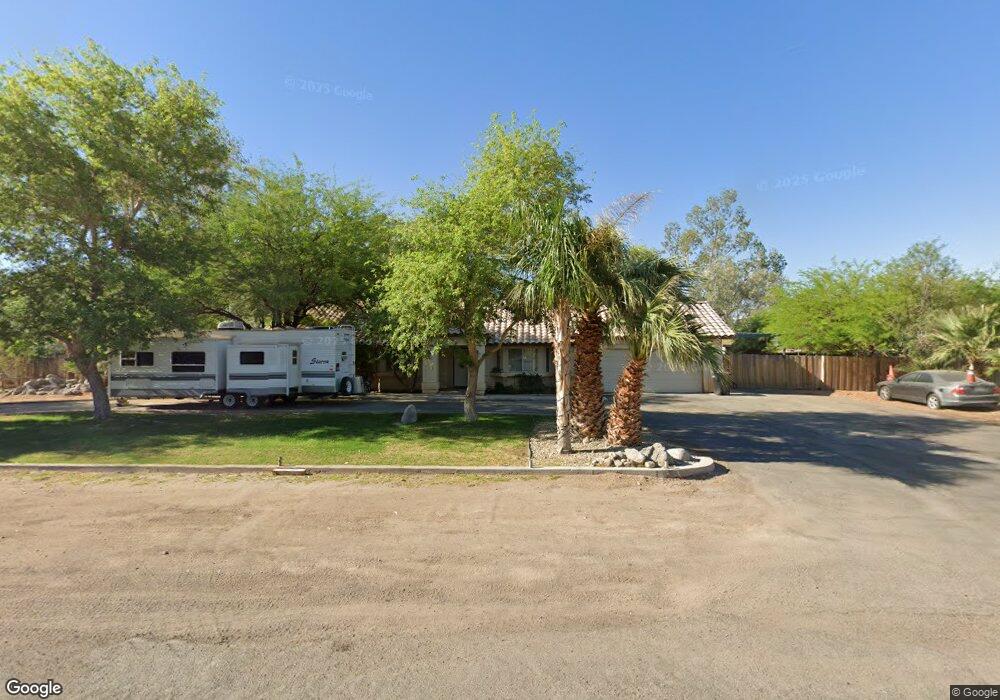
649 Lee Rd Imperial, CA 92251
Estimated Value: $377,000 - $526,000
Studio
--
Bath
1,520
Sq Ft
$306/Sq Ft
Est. Value
About This Home
This home is located at 649 Lee Rd, Imperial, CA 92251 and is currently estimated at $464,817, approximately $305 per square foot. 649 Lee Rd is a home located in Imperial County with nearby schools including Ben Hulse Elementary School, Frank M. Wright Middle School, and Imperial High School.
Ownership History
Date
Name
Owned For
Owner Type
Purchase Details
Closed on
Feb 18, 1999
Sold by
Va
Bought by
Vogel Ted A and Vogel Heidi R
Current Estimated Value
Home Financials for this Owner
Home Financials are based on the most recent Mortgage that was taken out on this home.
Original Mortgage
$119,200
Outstanding Balance
$28,311
Interest Rate
6.78%
Mortgage Type
Seller Take Back
Estimated Equity
$436,506
Purchase Details
Closed on
May 8, 1998
Sold by
Norwest Mtg Inc
Bought by
Va
Create a Home Valuation Report for This Property
The Home Valuation Report is an in-depth analysis detailing your home's value as well as a comparison with similar homes in the area
Purchase History
We collect this data history from publicly available records. To have your information removed, we recommend requesting removal directly through your county’s website.
| Date | Buyer | Sale Price | Title Company |
|---|---|---|---|
| Vogel Ted A | $120,000 | Chicago Title Co | |
| Va | -- | Chicago Title Co | |
| Norwest Mtg Inc | $106,678 | Chicago Title Co |
Source: Public Records
Mortgage History
We collect this data history from publicly available records. To have your information removed, we recommend requesting removal directly through your county’s website.
| Date | Status | Borrower | Loan Amount |
|---|---|---|---|
| Open | Vogel Ted A | $119,200 |
Source: Public Records
Tax History
| Year | Tax Paid | Tax Assessment Tax Assessment Total Assessment is a certain percentage of the fair market value that is determined by local assessors to be the total taxable value of land and additions on the property. | Land | Improvement |
|---|---|---|---|---|
| 2025 | $2,342 | $214,632 | $50,153 | $164,479 |
| 2023 | $2,342 | $206,299 | $48,206 | $158,093 |
| 2022 | $2,291 | $202,255 | $47,261 | $154,994 |
| 2021 | $2,256 | $198,290 | $46,335 | $151,955 |
| 2020 | $2,233 | $196,257 | $45,860 | $150,397 |
| 2019 | $2,202 | $192,410 | $44,961 | $147,449 |
| 2018 | $2,173 | $188,638 | $44,080 | $144,558 |
| 2017 | $2,049 | $184,940 | $43,216 | $141,724 |
| 2016 | $1,976 | $181,315 | $42,369 | $138,946 |
| 2015 | $1,996 | $178,592 | $41,733 | $136,859 |
| 2014 | $1,867 | $175,095 | $40,916 | $134,179 |
Source: Public Records
Map
Nearby Homes
- 603 W Murphy Rd
- 2815 Powell Ct
- 627 W Belford Rd
- 567 Lee Rd
- 711 W Worthington Rd
- 2664 Oasis St
- 657 Cactus St Unit 2
- 73 Redwood
- 511 Quail Ct
- 623 Bahia St
- 619 N E St
- 680 Linda Vista St
- 220 W 14th St
- 116 W 12th St
- 509 N Imperial Ave
- 672 Las Cuspides St
- 475 Palomino Ct
- 480 Palomino Ct
- 473 Palomino Ct
- 483 Buckskin Ranch Dr
Your Personal Tour Guide
Ask me questions while you tour the home.