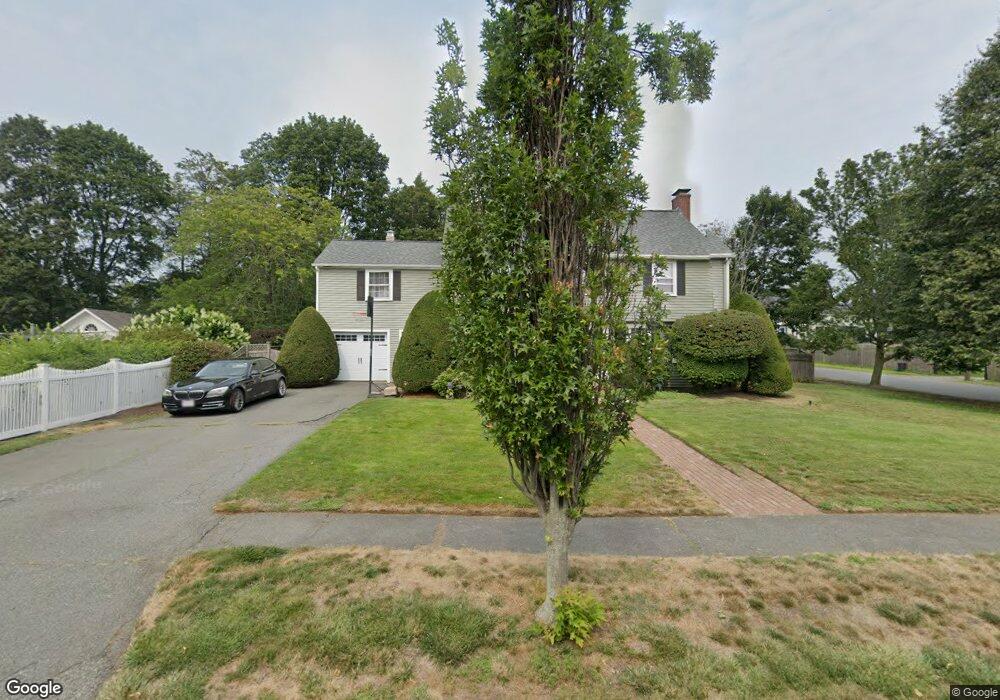
65 Lindall St Danvers, MA 01923
Estimated Value: $912,117 - $1,134,000
5
Beds
4
Baths
3,509
Sq Ft
$292/Sq Ft
Est. Value
About This Home
This home is located at 65 Lindall St, Danvers, MA 01923 and is currently estimated at $1,023,029, approximately $291 per square foot. 65 Lindall St is a home located in Essex County with nearby schools including Danvers High School, St. Mary of the Annunciation School, and St. John's Prep.
Ownership History
Date
Name
Owned For
Owner Type
Purchase Details
Closed on
Apr 28, 2004
Sold by
Hadden Robert and Hadden Tracy L
Bought by
Maylor Kenneth J
Current Estimated Value
Home Financials for this Owner
Home Financials are based on the most recent Mortgage that was taken out on this home.
Original Mortgage
$512,000
Outstanding Balance
$237,689
Interest Rate
5.36%
Mortgage Type
Purchase Money Mortgage
Estimated Equity
$785,340
Purchase Details
Closed on
Oct 1, 1992
Sold by
B Cresse Nt
Bought by
Hadden Robert and Hadden Tracy L
Create a Home Valuation Report for This Property
The Home Valuation Report is an in-depth analysis detailing your home's value as well as a comparison with similar homes in the area
Home Values in the Area
Average Home Value in this Area
Purchase History
We collect this data history from publicly available records. To have your information removed, we recommend requesting removal directly through your county’s website.
| Date | Buyer | Sale Price | Title Company |
|---|---|---|---|
| Maylor Kenneth J | $640,000 | -- | |
| Hadden Robert | $212,500 | -- |
Source: Public Records
Mortgage History
We collect this data history from publicly available records. To have your information removed, we recommend requesting removal directly through your county’s website.
| Date | Status | Borrower | Loan Amount |
|---|---|---|---|
| Open | Hadden Robert | $94,500 | |
| Open | Hadden Robert | $512,000 | |
| Previous Owner | Hadden Robert | $272,200 |
Source: Public Records
Tax History
| Year | Tax Paid | Tax Assessment Tax Assessment Total Assessment is a certain percentage of the fair market value that is determined by local assessors to be the total taxable value of land and additions on the property. | Land | Improvement |
|---|---|---|---|---|
| 2025 | $9,157 | $833,200 | $372,800 | $460,400 |
| 2024 | $8,980 | $808,300 | $360,200 | $448,100 |
| 2023 | $8,455 | $719,600 | $327,300 | $392,300 |
| 2022 | $8,377 | $661,700 | $297,000 | $364,700 |
| 2021 | $7,947 | $595,300 | $274,200 | $321,100 |
| 2020 | $7,775 | $595,300 | $274,200 | $321,100 |
| 2019 | $7,331 | $552,000 | $240,100 | $311,900 |
| 2018 | $7,084 | $523,200 | $235,100 | $288,100 |
| 2017 | $7,145 | $503,500 | $233,800 | $269,700 |
| 2016 | $6,874 | $484,100 | $221,200 | $262,900 |
| 2015 | $6,313 | $423,400 | $183,200 | $240,200 |
Source: Public Records
Map
Nearby Homes
- 53 Summer St
- 8 Putnam St Unit 3
- 4 Alden St Unit 3
- 130 Pine St
- 66 Lawrence St
- 6 Adams St
- 180 Conant Conant St
- 77 Centre St
- 45 Abington Rd Unit 45
- 97 Sylvan St Unit 7
- 95 Abington Rd Unit 95
- 35 Collins St Unit 88
- 6 Jersey Ln
- 37 Princeton St
- 166 High St
- 12 Wildwood Rd
- 103 Wenham St
- 30 Walter Rd
- 320 Newbury St Unit 902
- 103 Newbury St Unit 1
Your Personal Tour Guide
Ask me questions while you tour the home.