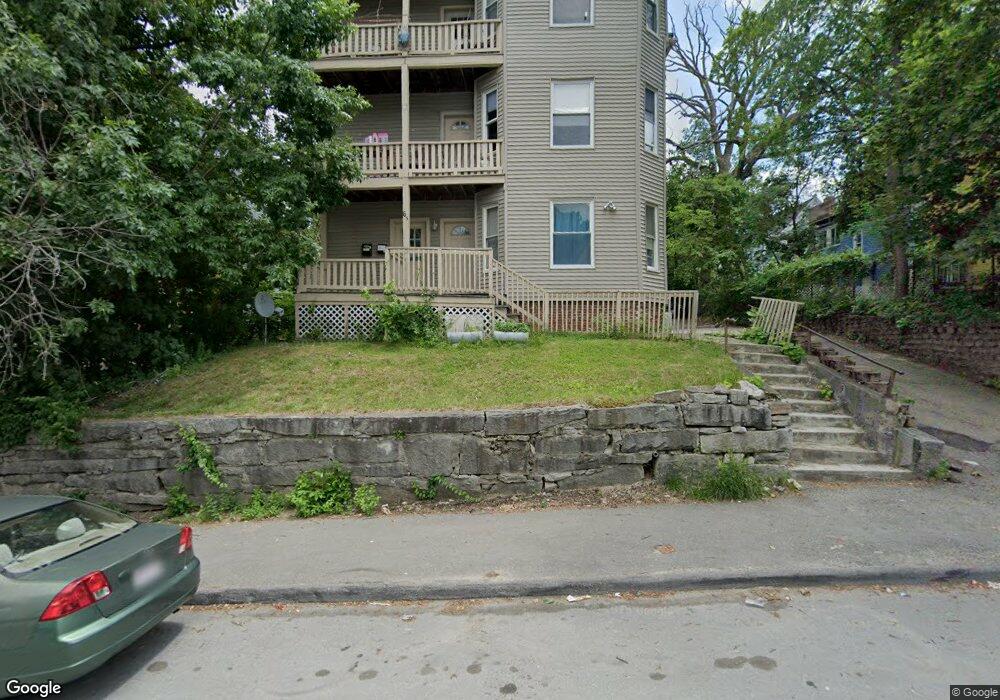
65 Mason St Worcester, MA 01610
University Park NeighborhoodEstimated Value: $793,000 - $939,000
12
Beds
3
Baths
4,896
Sq Ft
$181/Sq Ft
Est. Value
About This Home
This home is located at 65 Mason St, Worcester, MA 01610 and is currently estimated at $888,000, approximately $181 per square foot. 65 Mason St is a home located in Worcester County with nearby schools including Jacob Hiatt Magnet School, Chandler Magnet, and Woodland Academy.
Ownership History
Date
Name
Owned For
Owner Type
Purchase Details
Closed on
May 25, 2001
Sold by
Department Of Housing & Urban Dev
Bought by
Spyropoulos Spiridon D
Current Estimated Value
Home Financials for this Owner
Home Financials are based on the most recent Mortgage that was taken out on this home.
Original Mortgage
$82,500
Outstanding Balance
$30,108
Interest Rate
7.05%
Estimated Equity
$857,892
Purchase Details
Closed on
Jan 7, 2000
Sold by
Savankham Kongsavanh
Bought by
Norwest Mtg Inc
Purchase Details
Closed on
May 30, 1995
Sold by
Department Of Housing & Urban Dev
Bought by
Spencer Pauline and Mcelreath Uta
Purchase Details
Closed on
Oct 11, 1994
Sold by
Bancplus Mtg Corp
Bought by
Department Of Housing & Urban Dev
Purchase Details
Closed on
Jun 8, 1994
Sold by
Toledo Carmen
Bought by
Bancplus Mtg Corp
Create a Home Valuation Report for This Property
The Home Valuation Report is an in-depth analysis detailing your home's value as well as a comparison with similar homes in the area
Home Values in the Area
Average Home Value in this Area
Purchase History
We collect this data history from publicly available records. To have your information removed, we recommend requesting removal directly through your county’s website.
| Date | Buyer | Sale Price | Title Company |
|---|---|---|---|
| Spyropoulos Spiridon D | $110,678 | -- | |
| Norwest Mtg Inc | $122,800 | -- | |
| Spencer Pauline | $23,600 | -- | |
| Department Of Housing & Urban Dev | $126,500 | -- | |
| Bancplus Mtg Corp | $152,613 | -- |
Source: Public Records
Mortgage History
We collect this data history from publicly available records. To have your information removed, we recommend requesting removal directly through your county’s website.
| Date | Status | Borrower | Loan Amount |
|---|---|---|---|
| Open | Bancplus Mtg Corp | $82,500 | |
| Previous Owner | Bancplus Mtg Corp | $109,800 |
Source: Public Records
Tax History
| Year | Tax Paid | Tax Assessment Tax Assessment Total Assessment is a certain percentage of the fair market value that is determined by local assessors to be the total taxable value of land and additions on the property. | Land | Improvement |
|---|---|---|---|---|
| 2025 | $10,383 | $787,200 | $76,600 | $710,600 |
| 2024 | $9,497 | $690,700 | $76,600 | $614,100 |
| 2023 | $9,053 | $631,300 | $61,500 | $569,800 |
| 2022 | $7,885 | $518,400 | $49,200 | $469,200 |
| 2021 | $7,100 | $436,100 | $39,400 | $396,700 |
| 2020 | $6,511 | $383,000 | $39,500 | $343,500 |
| 2019 | $4,804 | $266,900 | $39,000 | $227,900 |
| 2018 | $4,686 | $247,800 | $39,000 | $208,800 |
| 2017 | $4,382 | $228,000 | $39,000 | $189,000 |
| 2016 | $4,258 | $206,600 | $31,100 | $175,500 |
| 2015 | $4,146 | $206,600 | $31,100 | $175,500 |
| 2014 | $4,037 | $206,600 | $31,100 | $175,500 |
Source: Public Records
Map
Nearby Homes
Your Personal Tour Guide
Ask me questions while you tour the home.