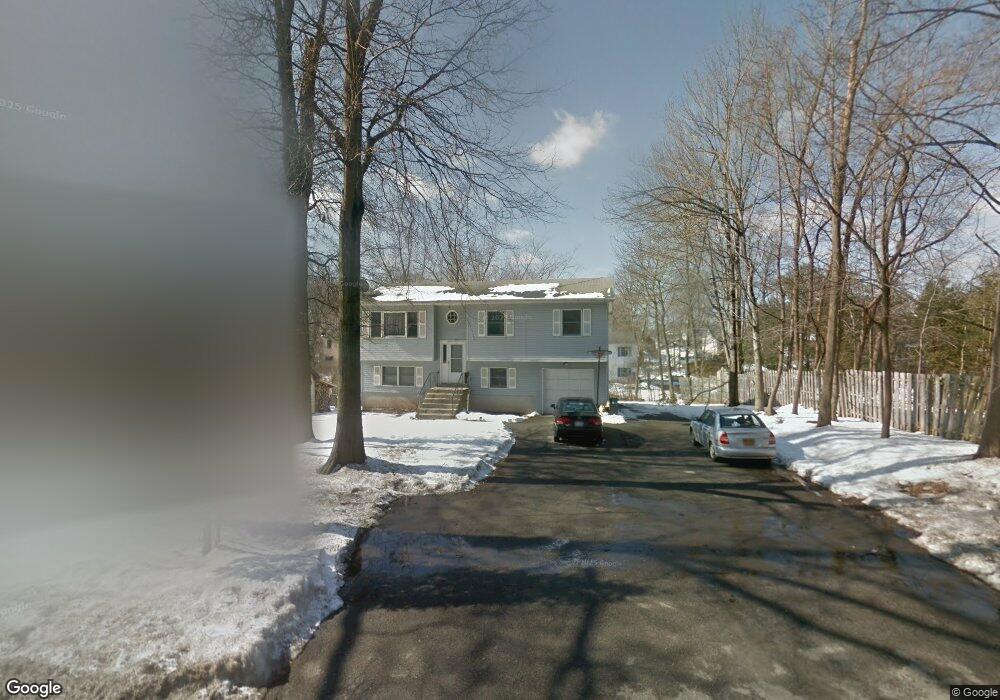
65 N Route 303 Congers, NY 10920
Estimated Value: $701,000 - $730,000
--
Bed
--
Bath
1,164
Sq Ft
$612/Sq Ft
Est. Value
About This Home
This home is located at 65 N Route 303, Congers, NY 10920 and is currently estimated at $712,000, approximately $611 per square foot. 65 N Route 303 is a home located in Rockland County with nearby schools including Lakewood Elementary School, Felix Festa Middle School, and Clarkstown North Senior High School.
Ownership History
Date
Name
Owned For
Owner Type
Purchase Details
Closed on
Jul 12, 2001
Sold by
Carroll William and Carroll Michael
Bought by
Desai Devendra and Desai Kumud D
Current Estimated Value
Home Financials for this Owner
Home Financials are based on the most recent Mortgage that was taken out on this home.
Original Mortgage
$225,000
Interest Rate
7.2%
Mortgage Type
Purchase Money Mortgage
Create a Home Valuation Report for This Property
The Home Valuation Report is an in-depth analysis detailing your home's value as well as a comparison with similar homes in the area
Home Values in the Area
Average Home Value in this Area
Purchase History
| Date | Buyer | Sale Price | Title Company |
|---|---|---|---|
| Desai Devendra | $250,000 | -- | |
| Desai Devendra | $250,000 | -- | |
| Desai Devendra | $250,000 | -- |
Source: Public Records
Mortgage History
| Date | Status | Borrower | Loan Amount |
|---|---|---|---|
| Previous Owner | Desai Devendra | $225,000 |
Source: Public Records
Tax History Compared to Growth
Tax History
| Year | Tax Paid | Tax Assessment Tax Assessment Total Assessment is a certain percentage of the fair market value that is determined by local assessors to be the total taxable value of land and additions on the property. | Land | Improvement |
|---|---|---|---|---|
| 2024 | $15,219 | $120,100 | $21,700 | $98,400 |
| 2023 | $15,219 | $120,100 | $21,700 | $98,400 |
| 2022 | $11,239 | $120,100 | $21,700 | $98,400 |
| 2021 | $11,239 | $120,100 | $21,700 | $98,400 |
| 2020 | $10,946 | $120,100 | $21,700 | $98,400 |
| 2019 | $9,973 | $111,100 | $21,700 | $89,400 |
| 2018 | $9,973 | $111,100 | $21,700 | $89,400 |
| 2017 | $9,720 | $111,100 | $21,700 | $89,400 |
| 2016 | $9,670 | $111,100 | $21,700 | $89,400 |
| 2015 | -- | $111,100 | $21,700 | $89,400 |
| 2014 | -- | $111,100 | $21,700 | $89,400 |
Source: Public Records
Map
Nearby Homes
- 48 Lakewood Dr
- 47 Sheridan Ave
- 126 N Route 303 Unit 2
- 16 Trevor Lake Dr
- 20 S Rockland Ave
- 46 Old Lake Rd
- 16 Lamborn Ave
- 44 Old Lake Rd Unit 44
- 5 Cygnet Rd
- 54-56 S Grant Ave
- 83 N Grant Ave
- 126 Route 303 Unit 2
- 4 Waters Edge
- 88 Snedecker Ave
- 93 Highway Ave
- 85 Lenox Ave
- 132 S Conger Ave
- 116 Highway Ave
- 142 Old Haverstraw Rd
- 10 Glen Ct