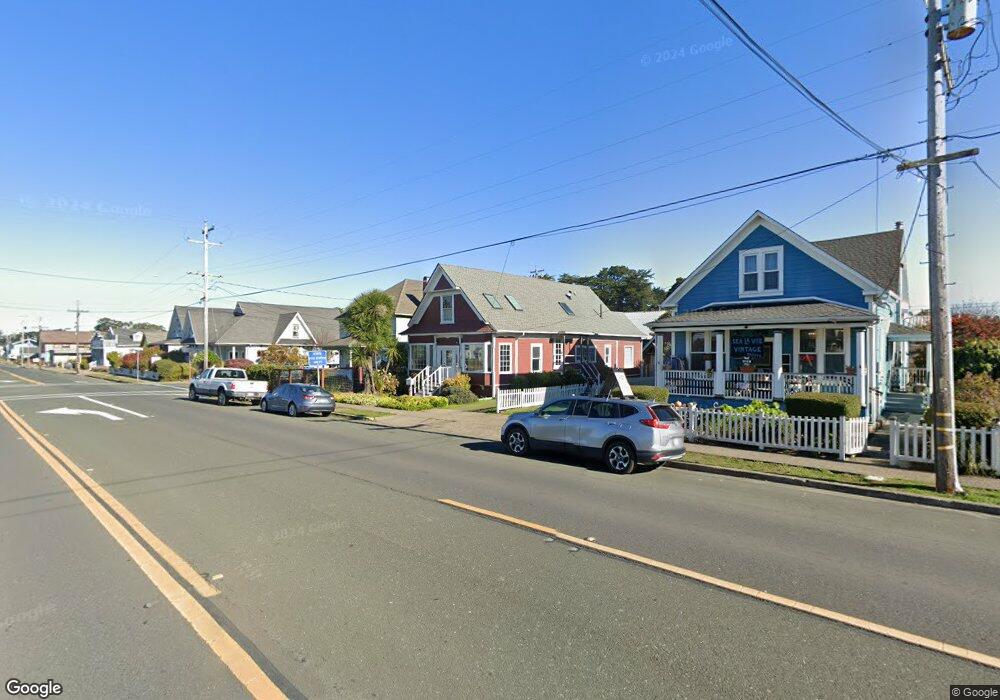
650 N Main St Fort Bragg, CA 95437
Estimated Value: $306,446
3
Beds
2
Baths
1,473
Sq Ft
$208/Sq Ft
Est. Value
About This Home
This home is located at 650 N Main St, Fort Bragg, CA 95437 and is currently estimated at $306,446, approximately $208 per square foot. 650 N Main St is a home located in Mendocino County with nearby schools including Fort Bragg High School and Three Rivers Charter School.
Ownership History
Date
Name
Owned For
Owner Type
Purchase Details
Closed on
Jan 25, 2018
Sold by
John Trillia Roy Alan and King Trillia Susan Deborah
Bought by
Little Lake Partners Llc
Current Estimated Value
Purchase Details
Closed on
Oct 26, 2017
Sold by
Vardenaga Robert
Bought by
King Trilla Roy Alen John and King Trilla Deborah
Purchase Details
Closed on
Oct 29, 2013
Sold by
Vardanega Meina Xu
Bought by
Vardanega Robert
Purchase Details
Closed on
Aug 20, 2013
Sold by
Blom Cindy
Bought by
Vardanega Robert
Purchase Details
Closed on
Sep 10, 2003
Sold by
Blom Cindy L and Blom Cynthia Lynn
Bought by
Blom Cindy L
Home Financials for this Owner
Home Financials are based on the most recent Mortgage that was taken out on this home.
Original Mortgage
$162,500
Interest Rate
6.3%
Mortgage Type
Commercial
Purchase Details
Closed on
Jul 20, 1999
Sold by
Mendo Property Associates
Bought by
Blom Cindy Lynn
Create a Home Valuation Report for This Property
The Home Valuation Report is an in-depth analysis detailing your home's value as well as a comparison with similar homes in the area
Home Values in the Area
Average Home Value in this Area
Purchase History
| Date | Buyer | Sale Price | Title Company |
|---|---|---|---|
| Little Lake Partners Llc | -- | Redwood Empire Titole Co Of | |
| King Trilla Roy Alen John | $250,000 | Redwood Empire Title Co | |
| Vardanega Robert | -- | None Available | |
| Vardanega Robert | $153,366 | None Available | |
| Blom Cindy L | -- | First American Title Co | |
| Blom Cindy Lynn | -- | First American Title Co |
Source: Public Records
Mortgage History
| Date | Status | Borrower | Loan Amount |
|---|---|---|---|
| Previous Owner | Blom Cindy L | $162,500 |
Source: Public Records
Tax History Compared to Growth
Tax History
| Year | Tax Paid | Tax Assessment Tax Assessment Total Assessment is a certain percentage of the fair market value that is determined by local assessors to be the total taxable value of land and additions on the property. | Land | Improvement |
|---|---|---|---|---|
| 2025 | $3,804 | $324,053 | $147,916 | $176,137 |
| 2023 | $3,804 | $311,472 | $142,173 | $169,299 |
| 2022 | $3,785 | $305,366 | $139,386 | $165,980 |
| 2021 | $3,570 | $299,379 | $136,653 | $162,726 |
| 2020 | $3,497 | $296,310 | $135,252 | $161,058 |
| 2019 | $3,050 | $255,000 | $132,600 | $122,400 |
| 2018 | $3,011 | $250,000 | $130,000 | $120,000 |
| 2017 | $1,857 | $161,992 | $95,062 | $66,930 |
| 2016 | $1,821 | $158,815 | $93,198 | $65,617 |
| 2015 | $1,793 | $156,430 | $91,798 | $64,632 |
| 2014 | $1,746 | $153,366 | $90,000 | $63,366 |
Source: Public Records
Map
Nearby Homes
- 119 E Pine St
- 715 West St
- 423 N Franklin St
- 944 Stewart St
- 924 Glass Beach Dr
- 142 S Franklin St
- 251 S Franklin St
- 1184 N Main St Unit 1
- 443 S Harrison St
- 459 S Mcpherson St
- 494 S Whipple St
- 571 S Franklin St
- 215 S Sanderson Way
- 575 S Whipple St
- 517 S Lincoln St
- 1261 N Main St
- 32000 Airport Rd
- 854 Woodward St
- 300 N Harbor Dr
- 19351 Del Mar Dr