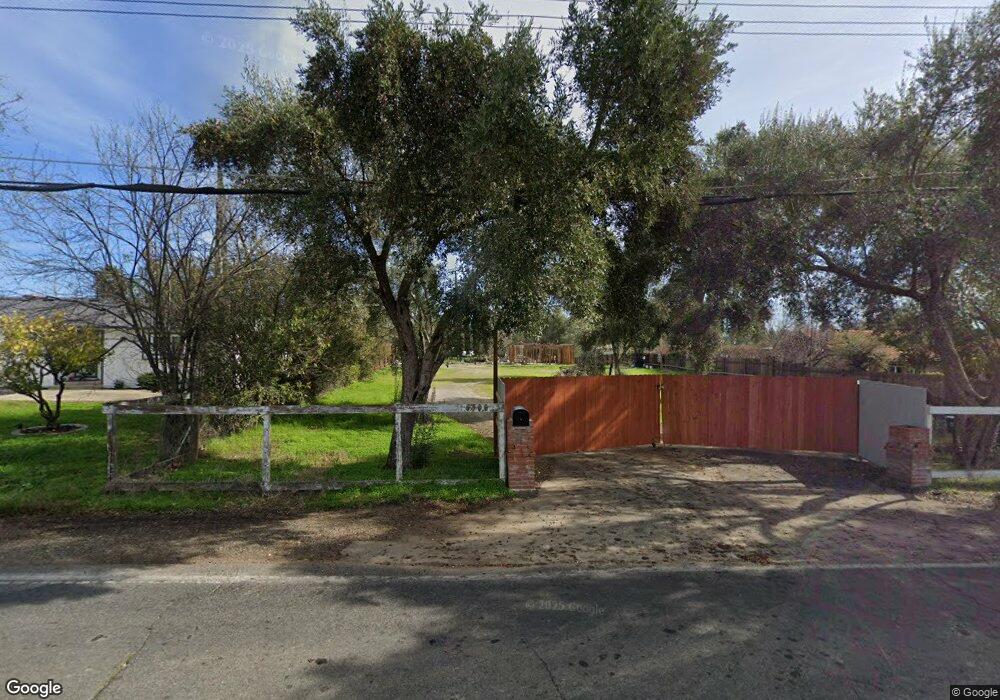
6500 Chestnut Ave Orangevale, CA 95662
Estimated Value: $755,000 - $913,497
3
Beds
1
Bath
1,834
Sq Ft
$452/Sq Ft
Est. Value
About This Home
This home is located at 6500 Chestnut Ave, Orangevale, CA 95662 and is currently estimated at $829,624, approximately $452 per square foot. 6500 Chestnut Ave is a home located in Sacramento County with nearby schools including Ottomon Way Elementary School, Louis Pasteur Fundamental Middle School, and Casa Roble Fundamental High School.
Ownership History
Date
Name
Owned For
Owner Type
Purchase Details
Closed on
Feb 26, 2026
Sold by
Korchuk Nelya
Bought by
Korchuk Anatolii
Current Estimated Value
Home Financials for this Owner
Home Financials are based on the most recent Mortgage that was taken out on this home.
Original Mortgage
$1,322,400
Outstanding Balance
$1,322,400
Interest Rate
6.06%
Mortgage Type
New Conventional
Estimated Equity
-$492,776
Purchase Details
Closed on
May 12, 2023
Sold by
Espanol Tessie
Bought by
Korchuk Anatolii and Korchuk Nelya
Home Financials for this Owner
Home Financials are based on the most recent Mortgage that was taken out on this home.
Original Mortgage
$480,000
Interest Rate
6.32%
Mortgage Type
New Conventional
Purchase Details
Closed on
Oct 8, 2003
Sold by
Revocab Schneider Robin K
Bought by
Espanol Tessie
Home Financials for this Owner
Home Financials are based on the most recent Mortgage that was taken out on this home.
Original Mortgage
$308,000
Interest Rate
6.4%
Mortgage Type
Unknown
Purchase Details
Closed on
Jul 30, 1998
Sold by
Schneider Robin K
Bought by
Schneider Robin K
Create a Home Valuation Report for This Property
The Home Valuation Report is an in-depth analysis detailing your home's value as well as a comparison with similar homes in the area
Home Values in the Area
Average Home Value in this Area
Purchase History
We collect this data history from publicly available records. To have your information removed, we recommend requesting removal directly through your county’s website.
| Date | Buyer | Sale Price | Title Company |
|---|---|---|---|
| Korchuk Anatolii | -- | Fidelity National Title Compan | |
| Korchuk Anatolii | $730,000 | First American Title | |
| Espanol Tessie | $385,000 | Commonwealth Land Title Co | |
| Schneider Robin K | -- | -- |
Source: Public Records
Mortgage History
We collect this data history from publicly available records. To have your information removed, we recommend requesting removal directly through your county’s website.
| Date | Status | Borrower | Loan Amount |
|---|---|---|---|
| Open | Korchuk Anatolii | $1,322,400 | |
| Previous Owner | Korchuk Anatolii | $480,000 | |
| Previous Owner | Espanol Tessie | $308,000 |
Source: Public Records
Tax History
| Year | Tax Paid | Tax Assessment Tax Assessment Total Assessment is a certain percentage of the fair market value that is determined by local assessors to be the total taxable value of land and additions on the property. | Land | Improvement |
|---|---|---|---|---|
| 2025 | $9,144 | $759,492 | $400,554 | $358,938 |
| 2024 | $9,017 | $744,600 | $392,700 | $351,900 |
| 2023 | $7,094 | $589,165 | $382,635 | $206,530 |
| 2022 | $7,058 | $577,614 | $375,133 | $202,481 |
| 2021 | $6,957 | $566,289 | $367,778 | $198,511 |
| 2020 | $5,957 | $488,088 | $261,476 | $226,612 |
| 2019 | $5,755 | $471,583 | $252,634 | $218,949 |
| 2018 | $5,530 | $449,127 | $240,604 | $208,523 |
| 2017 | $5,224 | $419,746 | $224,864 | $194,882 |
| 2016 | $4,535 | $381,588 | $204,422 | $177,166 |
| 2015 | $4,314 | $363,418 | $194,688 | $168,730 |
| 2014 | $4,146 | $349,440 | $187,200 | $162,240 |
Source: Public Records
Map
Nearby Homes
- 6310 Chestnut Ave
- 9101 Orangevale Ave
- 9065 Wickstrom Dr
- 9340 Orangevale Ave Unit 26
- 9340 Orangevale Ave Unit 11
- 6805 Chestnut Ave
- 9028 Wickstrom Dr
- 9022 Wickstrom Dr
- 6412 Benning St Unit 5B
- 9023 Wickstrom Dr
- 8981 Wickstrom Dr
- 9011 Wickstrom Dr
- 8987 Wickstrom Dr
- 8999 Wickstrom Dr
- 8993 Wickstrom Dr
- 9169 Renee Ann St
- 6913 Chestnut Ave
- 9077 Westeria Way
- 9039 Crescenda Ln
- 9320 Tilton Ln
- 6436 Chestnut Ave
- 6432 Chestnut Ave
- 6508 Chestnut Ave
- 9104 Ivy League Cir
- 6518 Chestnut Ave
- 6422 Chestnut Ave
- 6422 Chestnut Ave
- 9192 Shawmutt Ct
- 9105 Ivy League Cir
- 6412 Chestnut Ave
- 6524 Chestnut Ave
- 9112 Ivy League Cir
- 6520 Chestnut Ave
- 6408 Chestnut Ave
- 9115 Ivy League Cir
- 9184 Shawmutt Ct
- 6528 Chestnut Ave
- 9193 Ivy League Cir
- 9120 Ivy League Cir
- 9193 Shawmutt Ct
Your Personal Tour Guide
Ask me questions while you tour the home.