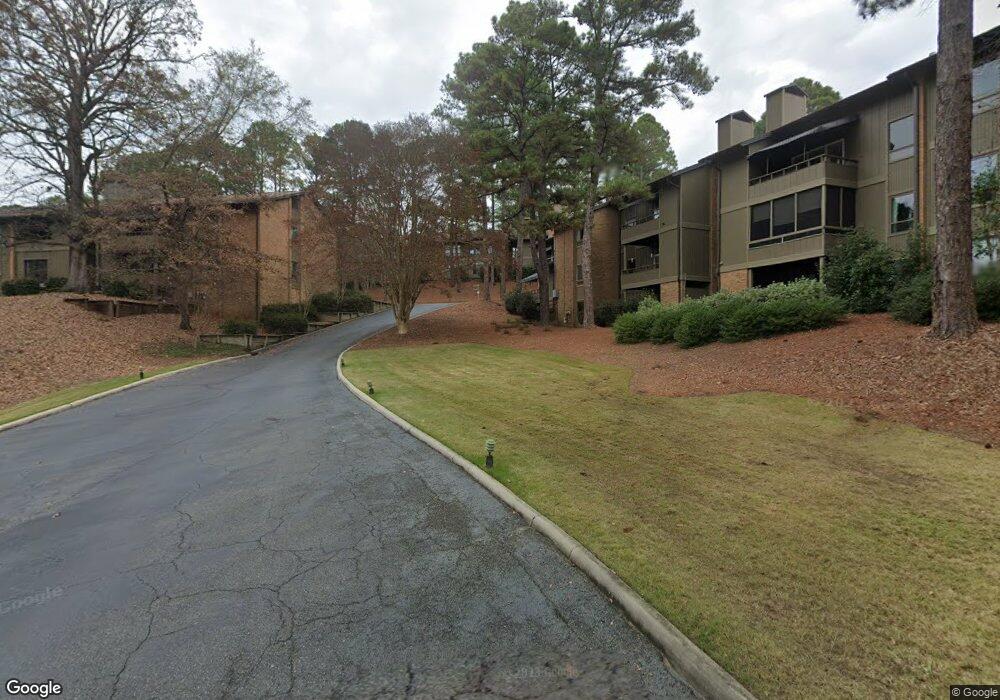
6500 Standing Boy Rd Unit 23 Columbus, GA 31904
Northern Columbus NeighborhoodEstimated Value: $203,000 - $256,000
3
Beds
2
Baths
1,699
Sq Ft
$140/Sq Ft
Est. Value
About This Home
This home is located at 6500 Standing Boy Rd Unit 23, Columbus, GA 31904 and is currently estimated at $238,516, approximately $140 per square foot. 6500 Standing Boy Rd Unit 23 is a home located in Muscogee County with nearby schools including River Road Elementary School, Double Churches Middle School, and Northside High School.
Ownership History
Date
Name
Owned For
Owner Type
Purchase Details
Closed on
Aug 3, 2022
Sold by
Jones Benjamin F
Bought by
Howard Bruce M
Current Estimated Value
Purchase Details
Closed on
Apr 15, 2021
Sold by
Abate Sandra R
Bought by
Groneman John Fredrick
Purchase Details
Closed on
Nov 6, 2017
Sold by
Parsons Charles M
Bought by
Dennard James Richard and Kirksey Grace
Purchase Details
Closed on
Aug 1, 2011
Sold by
Synovus Trust Co Trustee /Tr
Bought by
Parsons Charles M and Parsons Elizabeth D
Home Financials for this Owner
Home Financials are based on the most recent Mortgage that was taken out on this home.
Original Mortgage
$95,000
Interest Rate
4.53%
Mortgage Type
New Conventional
Purchase Details
Closed on
Mar 19, 2007
Sold by
Wachovia Bank Na and Saunders Smith Nancy
Bought by
Synovus Trust Co Na and Nancy S Smith Trust
Create a Home Valuation Report for This Property
The Home Valuation Report is an in-depth analysis detailing your home's value as well as a comparison with similar homes in the area
Home Values in the Area
Average Home Value in this Area
Purchase History
| Date | Buyer | Sale Price | Title Company |
|---|---|---|---|
| Howard Bruce M | $160,000 | Page Scranton Sprouse Tucker & | |
| Groneman John Fredrick | $107,000 | None Listed On Document | |
| Dennard James Richard | $160,000 | -- | |
| Parsons Charles M | $145,000 | -- | |
| Synovus Trust Co Na | -- | None Available |
Source: Public Records
Mortgage History
| Date | Status | Borrower | Loan Amount |
|---|---|---|---|
| Previous Owner | Parsons Charles M | $95,000 |
Source: Public Records
Tax History Compared to Growth
Tax History
| Year | Tax Paid | Tax Assessment Tax Assessment Total Assessment is a certain percentage of the fair market value that is determined by local assessors to be the total taxable value of land and additions on the property. | Land | Improvement |
|---|---|---|---|---|
| 2025 | $1,552 | $77,562 | $20,216 | $57,346 |
| 2024 | $1,552 | $77,562 | $20,216 | $57,346 |
| 2023 | $868 | $77,562 | $20,216 | $57,346 |
| 2022 | $1,619 | $65,256 | $20,216 | $45,040 |
| 2021 | $1,619 | $61,159 | $20,216 | $40,943 |
| 2020 | $1,620 | $61,159 | $20,216 | $40,943 |
| 2019 | $1,625 | $61,159 | $20,216 | $40,943 |
| 2018 | $1,625 | $61,159 | $20,216 | $40,943 |
| 2017 | $1,837 | $61,159 | $20,216 | $40,943 |
| 2016 | $1,841 | $52,704 | $16,812 | $35,892 |
| 2015 | $739 | $52,704 | $16,812 | $35,892 |
| 2014 | $740 | $52,704 | $16,812 | $35,892 |
| 2013 | -- | $65,140 | $16,812 | $48,328 |
Source: Public Records
Map
Nearby Homes
- 6500 Standing Boy Rd Unit 6
- 6528 Standing Boy Rd
- 6601 Standing Boy Rd
- 6688 Creekview Place
- 6619 Woodberry Rd
- 284 Zachary Ct
- 6101 River Rd Unit 2
- 239 Clearbrook Ln
- 235 Pebblebrook Ln
- 7044 Spring Walk Dr
- 223 Pebblebrook Ln
- 7015 Spring Walk Dr
- 6390 Cape Cod Dr
- 5 Bridgecreek Ct
- 5777 Roaring Branch Rd
- 280 Zachary Ct
- 252 Woodstream Dr
- 308 Woodstream Dr
- 264 Woodstream Dr
- 5 Mountain Ridge Ct
- 6500 Standing Boy Rd Unit 38
- 6500 Standing Boy Rd Unit 37
- 6500 Standing Boy Rd Unit 36
- 6500 Standing Boy Rd Unit 35
- 6500 Standing Boy Rd Unit 34
- 6500 Standing Boy Rd Unit 33
- 6500 Standing Boy Rd Unit 32
- 6500 Standing Boy Rd Unit 31
- 6500 Standing Boy Rd Unit 30
- 6500 Standing Boy Rd Unit 29
- 6500 Standing Boy Rd Unit 28
- 6500 Standing Boy Rd Unit 27
- 6500 Standing Boy Rd Unit 26
- 6500 Standing Boy Rd Unit 25
- 6500 Standing Boy Rd Unit 24
- 6500 Standing Boy Rd Unit 22
- 6500 Standing Boy Rd Unit 21
- 6500 Standing Boy Rd Unit 20
- 6500 Standing Boy Rd Unit 19
- 6500 Standing Boy Rd Unit 18