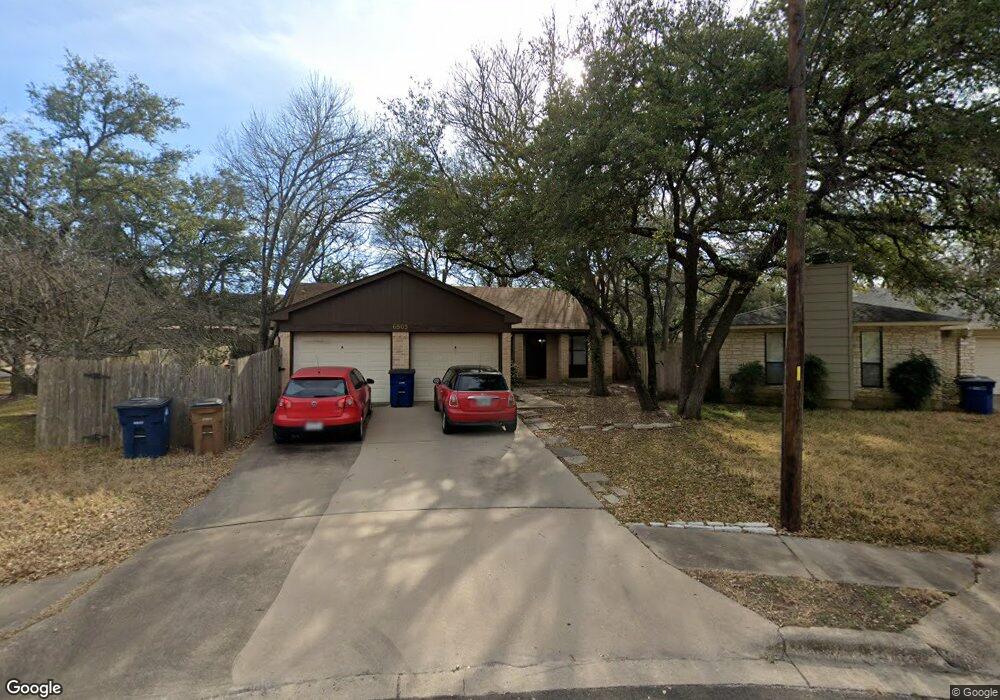
6501 Columbia Oaks Ct Unit 9 Austin, TX 78759
Great Hills NeighborhoodEstimated Value: $185,000 - $338,000
2
Beds
2
Baths
1,220
Sq Ft
$212/Sq Ft
Est. Value
About This Home
This home is located at 6501 Columbia Oaks Ct Unit 9, Austin, TX 78759 and is currently estimated at $259,225, approximately $212 per square foot. 6501 Columbia Oaks Ct Unit 9 is a home located in Travis County with nearby schools including Kathy Caraway Elementary School, Canyon Vista Middle, and Westwood High School.
Ownership History
Date
Name
Owned For
Owner Type
Purchase Details
Closed on
Jul 28, 2022
Sold by
Bouzaglo Stephen A
Bought by
Cihota Kathleen A
Current Estimated Value
Home Financials for this Owner
Home Financials are based on the most recent Mortgage that was taken out on this home.
Original Mortgage
$292,500
Outstanding Balance
$280,234
Interest Rate
5.78%
Mortgage Type
Balloon
Estimated Equity
-$21,009
Purchase Details
Closed on
Jan 6, 2017
Sold by
Hirshman Karl J
Bought by
Bouzaglo Stephen A and Bouzaglo Monica E
Home Financials for this Owner
Home Financials are based on the most recent Mortgage that was taken out on this home.
Original Mortgage
$157,410
Interest Rate
4.03%
Mortgage Type
New Conventional
Purchase Details
Closed on
Jan 12, 2011
Sold by
Lewis Teresa A
Bought by
Hirshman Karl J and Hirshman Survivors Trust
Create a Home Valuation Report for This Property
The Home Valuation Report is an in-depth analysis detailing your home's value as well as a comparison with similar homes in the area
Home Values in the Area
Average Home Value in this Area
Purchase History
| Date | Buyer | Sale Price | Title Company |
|---|---|---|---|
| Cihota Kathleen A | -- | Capstone Title | |
| Bouzaglo Stephen A | -- | Capital Title | |
| Hirshman Karl J | -- | Reliant Title Agency |
Source: Public Records
Mortgage History
| Date | Status | Borrower | Loan Amount |
|---|---|---|---|
| Open | Cihota Kathleen A | $292,500 | |
| Previous Owner | Bouzaglo Stephen A | $157,410 |
Source: Public Records
Tax History Compared to Growth
Tax History
| Year | Tax Paid | Tax Assessment Tax Assessment Total Assessment is a certain percentage of the fair market value that is determined by local assessors to be the total taxable value of land and additions on the property. | Land | Improvement |
|---|---|---|---|---|
| 2025 | $5,214 | $275,327 | $41,720 | $233,607 |
| 2023 | $6,099 | $326,350 | $41,720 | $284,630 |
| 2022 | $4,141 | $202,913 | $0 | $0 |
| 2021 | $4,148 | $184,466 | $41,720 | $174,354 |
| 2020 | $3,786 | $167,696 | $41,720 | $125,976 |
| 2018 | $4,286 | $184,198 | $41,720 | $142,478 |
| 2017 | $4,419 | $186,413 | $41,720 | $144,693 |
| 2016 | $4,419 | $186,413 | $41,720 | $144,693 |
| 2015 | $2,786 | $110,975 | $41,720 | $69,255 |
| 2014 | $2,786 | $111,898 | $41,720 | $70,178 |
Source: Public Records
Map
Nearby Homes
- 11703 Oak Knoll Dr
- 11501 Oak Knoll Dr
- 6009 Woodcrest Dr
- 7302 Bering Cove
- 7405 Attar Cove
- 6903 Narrow Oak Trail
- 11907 Highland Oaks Trail
- 5801 Sierra Madre
- 11929 Arabian Trail
- 12001 Commonwealth Way
- 11007 Grapevine Ln
- 11210 Deadoak Ln
- 11522 Antigua Dr
- 10902 Sierra Oaks
- 12211 Dundee Dr
- 10804 Buckthorn Dr
- 11108 Henge Dr
- 11804 Buckingham Rd
- 11811 Barrington Way
- 11714 Buckingham Rd
- 6501 Columbia Oaks Ct Unit A-1
- 6501 Columbia Oaks Ct Unit 10
- 6501 Columbia Oaks Ct Unit 8
- 6501 Columbia Oaks Ct Unit 7
- 6501 Columbia Oaks Ct Unit 6
- 6501 Columbia Oaks Ct Unit 5
- 6501 Columbia Oaks Ct Unit 4
- 6501 Columbia Oaks Ct Unit 3
- 6501 Columbia Oaks Ct Unit 2
- 6501 Columbia Oaks Ct Unit 1
- 6501 Columbia Oaks Ct Unit E9
- 11707 Three Oaks Trail
- 6005 Woodcrest Dr
- 11709 Three Oaks Trail
- 11610 Autumn Ridge Dr
- 6507 Woodcrest Dr
- 11711 Three Oaks Trail
- 6503 Columbia Oaks Ct Unit A
- 6503 Columbia Oaks Ct Unit B
- 6503 Columbia Oaks Ct