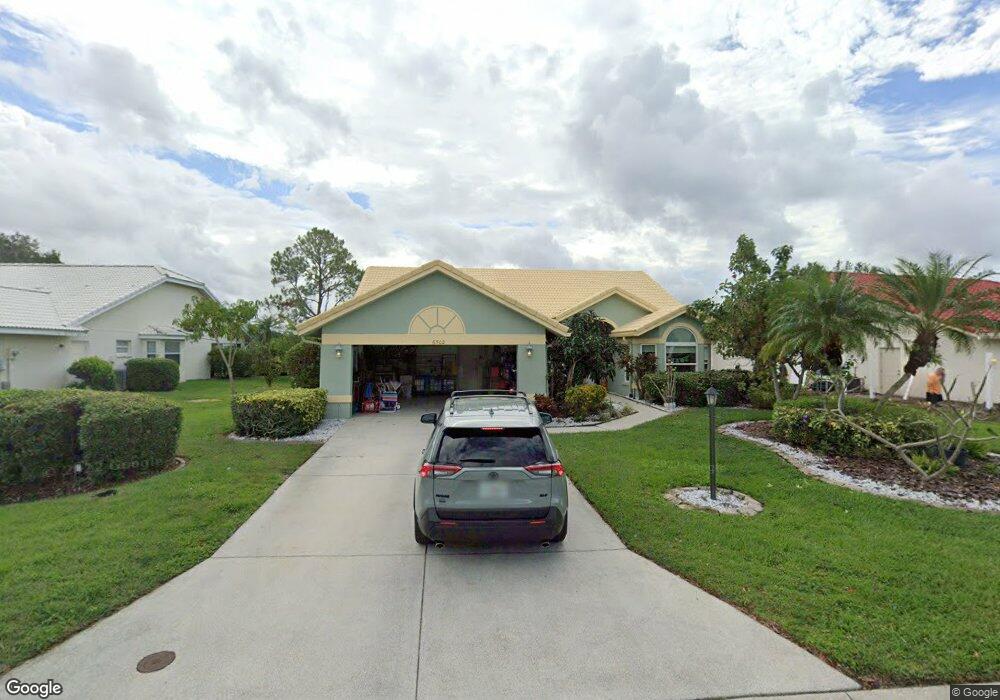
6502 Stone River Rd Unit 1 Bradenton, FL 34203
Tara NeighborhoodEstimated Value: $420,000 - $509,000
3
Beds
2
Baths
1,632
Sq Ft
$284/Sq Ft
Est. Value
About This Home
This home is located at 6502 Stone River Rd Unit 1, Bradenton, FL 34203 and is currently estimated at $462,922, approximately $283 per square foot. 6502 Stone River Rd Unit 1 is a home located in Manatee County with nearby schools including Tara Elementary School, Braden River Middle School, and Braden River High School.
Ownership History
Date
Name
Owned For
Owner Type
Purchase Details
Closed on
Nov 28, 2022
Sold by
Clayton Cara L
Bought by
Cara L Clayton Trust and Clayton
Current Estimated Value
Purchase Details
Closed on
Apr 7, 2017
Sold by
Clayton Robert Y and Clayton Imelda Samling
Bought by
Clayton Sara L
Purchase Details
Closed on
Jul 18, 2011
Sold by
Bechtold Robert H and Bechtold Sara M
Bought by
Clayton Robert Y and The Clayton Family Trust
Purchase Details
Closed on
Feb 25, 2005
Sold by
Geiger Carolyn
Bought by
Bechtold Robert H and Bechtold Sara M
Home Financials for this Owner
Home Financials are based on the most recent Mortgage that was taken out on this home.
Original Mortgage
$105,000
Interest Rate
5.61%
Mortgage Type
Purchase Money Mortgage
Purchase Details
Closed on
Jun 12, 2003
Sold by
Nelis Harry and Nelis Sandra E
Bought by
Geiger Carolyn
Create a Home Valuation Report for This Property
The Home Valuation Report is an in-depth analysis detailing your home's value as well as a comparison with similar homes in the area
Home Values in the Area
Average Home Value in this Area
Purchase History
| Date | Buyer | Sale Price | Title Company |
|---|---|---|---|
| Cara L Clayton Trust | $100 | None Listed On Document | |
| Clayton Sara L | $230,000 | Horizon Title | |
| Clayton Robert Y | $170,000 | Sunbelt Title Agency | |
| Bechtold Robert H | $299,000 | Barnes Walker Title Inc | |
| Geiger Carolyn | $225,000 | -- |
Source: Public Records
Mortgage History
| Date | Status | Borrower | Loan Amount |
|---|---|---|---|
| Previous Owner | Bechtold Robert H | $105,000 | |
| Closed | Bechtold Robert H | $149,000 |
Source: Public Records
Tax History
| Year | Tax Paid | Tax Assessment Tax Assessment Total Assessment is a certain percentage of the fair market value that is determined by local assessors to be the total taxable value of land and additions on the property. | Land | Improvement |
|---|---|---|---|---|
| 2025 | $3,342 | $268,594 | -- | -- |
| 2023 | $3,299 | $253,421 | $0 | $0 |
| 2022 | $3,209 | $246,040 | $0 | $0 |
| 2021 | $3,085 | $238,874 | $0 | $0 |
| 2020 | $3,188 | $235,576 | $40,000 | $195,576 |
| 2019 | $3,742 | $230,610 | $40,000 | $190,610 |
| 2018 | $3,765 | $228,933 | $40,000 | $188,933 |
| 2017 | $2,306 | $181,494 | $0 | $0 |
| 2016 | $1,998 | $157,278 | $0 | $0 |
Source: Public Records
Map
Nearby Homes
- 6507 Stone River Rd Unit 302
- 6507 Stone River Rd Unit 105
- 6507 Stone River Rd Unit 304
- 6501 Stone River Rd Unit 205
- 6501 Stone River Rd Unit 203
- 6501 Stone River Rd Unit 304
- 6501 Stone River Rd Unit 306
- 6501 Stone River Rd Unit 209
- 6501 Stone River Rd Unit 302
- 6609 Stone River Rd Unit 206
- 6503 Drewrys Bluff
- 6505 Stone River Rd Unit 103
- 6505 Stone River Rd Unit 202
- 6503 Stone River Rd Unit 109
- 6611 Stone River Rd Unit 102
- 6423 Drewrys Bluff
- 6707 Stone River Rd Unit 101
- 5528 Fair Oaks St Unit 19C
- 5433 Fair Oaks St Unit 7D
- 6546 Fairway Gardens Dr Unit 6546
- 6442 Stone River Rd
- 6504 Stone River Rd
- 6440 Stone River Rd
- 6506 Stone River Rd
- 6441 Stone River Rd
- 6438 Stone River Rd
- 6439 Stone River Rd
- 6508 Stone River Rd
- 6437 Stone River Rd
- 6436 Stone River Rd
- 6510 Stone River Rd
- 6435 Stone River Rd
- 6434 Stone River Rd
- 6433 Stone River Rd
- 6512 Stone River Rd
- 6431 Stone River Rd
- 6432 Stone River Rd
- 6511 Drewrys Bluff
- 6601 Drewrys Bluff
- 6509 Drewrys Bluff
Your Personal Tour Guide
Ask me questions while you tour the home.