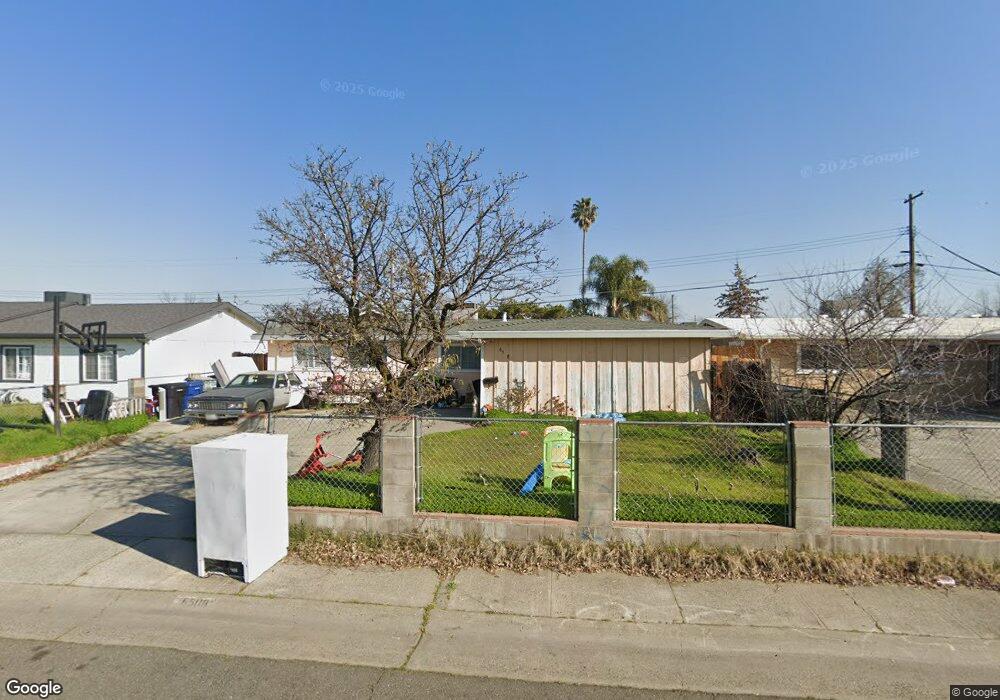
6508 Graylock Ln North Highlands, CA 95660
Larchmont Village NeighborhoodEstimated Value: $378,000 - $411,000
3
Beds
2
Baths
1,422
Sq Ft
$278/Sq Ft
Est. Value
About This Home
This home is located at 6508 Graylock Ln, North Highlands, CA 95660 and is currently estimated at $395,582, approximately $278 per square foot. 6508 Graylock Ln is a home located in Sacramento County with nearby schools including Village Elementary School, Highlands High School, and Creative Connections Arts Academy.
Ownership History
Date
Name
Owned For
Owner Type
Purchase Details
Closed on
Jan 3, 2022
Sold by
Simon Newton
Bought by
Simon Joseph Newton Living Trust
Current Estimated Value
Purchase Details
Closed on
Dec 18, 2017
Sold by
Jupp Amy
Bought by
Newton Simon
Purchase Details
Closed on
May 3, 2011
Sold by
Morequity Inc
Bought by
Newton Simon J and Jupp Amy E
Purchase Details
Closed on
Nov 8, 2010
Sold by
Orosco Santiago J and Orosco Shirley
Bought by
Morequity Inc
Purchase Details
Closed on
Mar 18, 2003
Sold by
Lawton Daniel Patrick and Lawton Donna Maria
Bought by
Orosco Santiago J and Orosco Shirley
Home Financials for this Owner
Home Financials are based on the most recent Mortgage that was taken out on this home.
Original Mortgage
$169,933
Interest Rate
5.79%
Mortgage Type
FHA
Create a Home Valuation Report for This Property
The Home Valuation Report is an in-depth analysis detailing your home's value as well as a comparison with similar homes in the area
Home Values in the Area
Average Home Value in this Area
Purchase History
| Date | Buyer | Sale Price | Title Company |
|---|---|---|---|
| Simon Joseph Newton Living Trust | -- | Heiler Randall | |
| Simon Joseph Newton Living Trust | -- | Heiler Randall | |
| Newton Simon | -- | None Available | |
| Newton Simon J | $73,500 | First American Title Company | |
| Morequity Inc | $130,000 | Accommodation | |
| Orosco Santiago J | $173,000 | Alliance Title Company |
Source: Public Records
Mortgage History
| Date | Status | Borrower | Loan Amount |
|---|---|---|---|
| Previous Owner | Orosco Santiago J | $169,933 |
Source: Public Records
Tax History
| Year | Tax Paid | Tax Assessment Tax Assessment Total Assessment is a certain percentage of the fair market value that is determined by local assessors to be the total taxable value of land and additions on the property. | Land | Improvement |
|---|---|---|---|---|
| 2025 | $1,067 | $94,155 | $38,430 | $55,725 |
| 2024 | $1,067 | $92,310 | $37,677 | $54,633 |
| 2023 | $1,074 | $90,501 | $36,939 | $53,562 |
| 2022 | $1,011 | $88,727 | $36,215 | $52,512 |
| 2021 | $1,009 | $86,988 | $35,505 | $51,483 |
| 2020 | $1,000 | $86,097 | $35,141 | $50,956 |
| 2019 | $987 | $84,409 | $34,452 | $49,957 |
| 2018 | $938 | $82,755 | $33,777 | $48,978 |
| 2017 | $962 | $81,133 | $33,115 | $48,018 |
| 2016 | $962 | $79,543 | $32,466 | $47,077 |
| 2015 | $904 | $78,349 | $31,979 | $46,370 |
| 2014 | $922 | $76,815 | $31,353 | $45,462 |
Source: Public Records
Map
Nearby Homes
- 6505 Pearson Ln
- 6353 La Cienega Dr
- 6518 Whitsett Dr
- 6605 Whitsett Dr
- 6600 Whitsett Dr
- 6500 Salida Way
- 3920 Floral Dr
- 6535 La Cienega Dr
- 6333 Whitecliff Way
- 4024 Alta Lorraine Way
- 6445 Channing Dr
- 6824 Lumry St
- 5851 Larry Way
- 4061 Cornelia Way
- 6449 Larry Way
- 6913 Weddigen Way
- 6109 Gay Way
- 6505 Channing Dr
- 6324 Longdale Dr
- 3910 Don Julio Blvd
- 6504 Graylock Ln
- 6512 Graylock Ln
- 6509 Pearson Ln
- 6513 Pearson Ln
- 6516 Graylock Ln
- 6500 Graylock Ln
- 6509 Graylock Ln
- 6505 Graylock Ln
- 6513 Graylock Ln
- 6517 Pearson Ln
- 6501 Pearson Ln
- 6520 Graylock Ln
- 6517 Graylock Ln
- 6501 Graylock Ln
- 6521 Pearson Ln
- 6521 Graylock Ln
- 6524 Graylock Ln
- 6508 Pearson Ln
- 6508 Stoneman Dr
- 6504 Pearson Ln
Your Personal Tour Guide
Ask me questions while you tour the home.