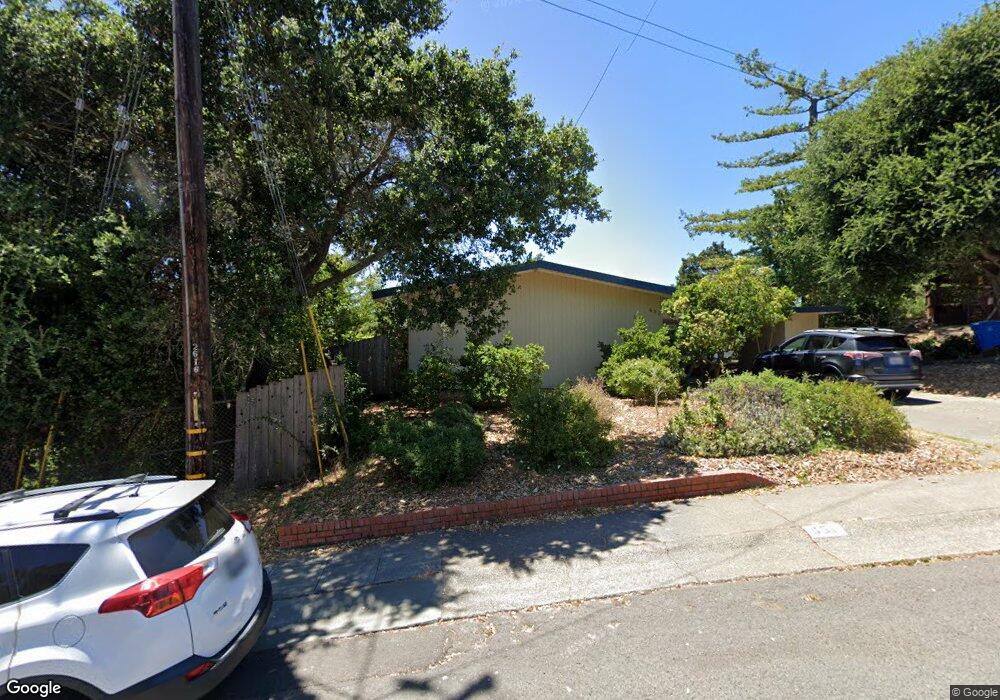
651 N Fair St Petaluma, CA 94952
Western Petaluma NeighborhoodEstimated Value: $862,000 - $1,109,000
3
Beds
2
Baths
1,656
Sq Ft
$598/Sq Ft
Est. Value
About This Home
This home is located at 651 N Fair St, Petaluma, CA 94952 and is currently estimated at $990,944, approximately $598 per square foot. 651 N Fair St is a home located in Sonoma County with nearby schools including Valley Vista Elementary School, Petaluma Junior High School, and Petaluma High School.
Ownership History
Date
Name
Owned For
Owner Type
Purchase Details
Closed on
May 24, 2021
Sold by
Giuffre Ronald J and Giuffre Ronald
Bought by
St John Carol and Carol St John Living Trust
Current Estimated Value
Purchase Details
Closed on
Feb 8, 2011
Sold by
Giuffre Nanelle
Bought by
Giuffre Ronald J and Giuffre Nanelle
Purchase Details
Closed on
Aug 18, 2009
Sold by
John St Carol
Bought by
John St Carol and Carol St John Living Trust
Purchase Details
Closed on
Sep 7, 2006
Sold by
Corippo Carol Mary and Corippo Carol
Bought by
Corippo Carol Mary and The Carol Mary Corippo Revocab
Purchase Details
Closed on
Dec 5, 1996
Sold by
St John James Daniel 1995 Revocable Tr and Nanelle
Bought by
Giuffre Nanelle and Corippo Carol
Purchase Details
Closed on
Jan 12, 1996
Sold by
St John James Daniel
Bought by
Giuffre Nanelle and Corippo Carol
Create a Home Valuation Report for This Property
The Home Valuation Report is an in-depth analysis detailing your home's value as well as a comparison with similar homes in the area
Home Values in the Area
Average Home Value in this Area
Purchase History
| Date | Buyer | Sale Price | Title Company |
|---|---|---|---|
| St John Carol | -- | None Available | |
| Giuffre Ronald J | -- | None Available | |
| John St Carol | -- | None Available | |
| St John Carol | -- | None Available | |
| Corippo Carol Mary | -- | None Available | |
| Giuffre Nanelle | -- | -- | |
| Giuffre Nanelle | -- | -- |
Source: Public Records
Tax History
| Year | Tax Paid | Tax Assessment Tax Assessment Total Assessment is a certain percentage of the fair market value that is determined by local assessors to be the total taxable value of land and additions on the property. | Land | Improvement |
|---|---|---|---|---|
| 2025 | $5,552 | $470,714 | $179,053 | $291,661 |
| 2024 | $5,180 | $461,486 | $175,543 | $285,943 |
| 2023 | $5,180 | $452,438 | $172,101 | $280,337 |
| 2022 | $981 | $76,235 | $21,254 | $54,981 |
| 2021 | $965 | $74,741 | $20,838 | $53,903 |
| 2020 | $972 | $73,976 | $20,625 | $53,351 |
| 2019 | $962 | $72,526 | $20,221 | $52,305 |
| 2018 | $959 | $71,105 | $19,825 | $51,280 |
| 2017 | $942 | $69,712 | $19,437 | $50,275 |
| 2016 | $912 | $68,346 | $19,056 | $49,290 |
| 2015 | $901 | $67,320 | $18,770 | $48,550 |
| 2014 | $897 | $66,002 | $18,403 | $47,599 |
Source: Public Records
Map
Nearby Homes
- 655 N Fair St
- 21 Brainerd Ave
- 11 Brainerd Ave
- 25 Brainerd Ave
- 15 Brainerd Ave
- 18 Brainerd Ave
- 14 Brainerd Ave
- 22 Brainerd Ave
- 30 Brainerd Ave
- 10 Brainerd Ave
- 629 N Fair St
- 24 Brainerd Ave
- 8 Brainerd Ave
- 806 Sonoma Ave
- 804 Sonoma Ave
- 808 Sonoma Ave
- 810 Sonoma Ave
- 812 Sonoma Ave
- 28 Brainerd Ave
- 1 Brainerd Ave
Your Personal Tour Guide
Ask me questions while you tour the home.