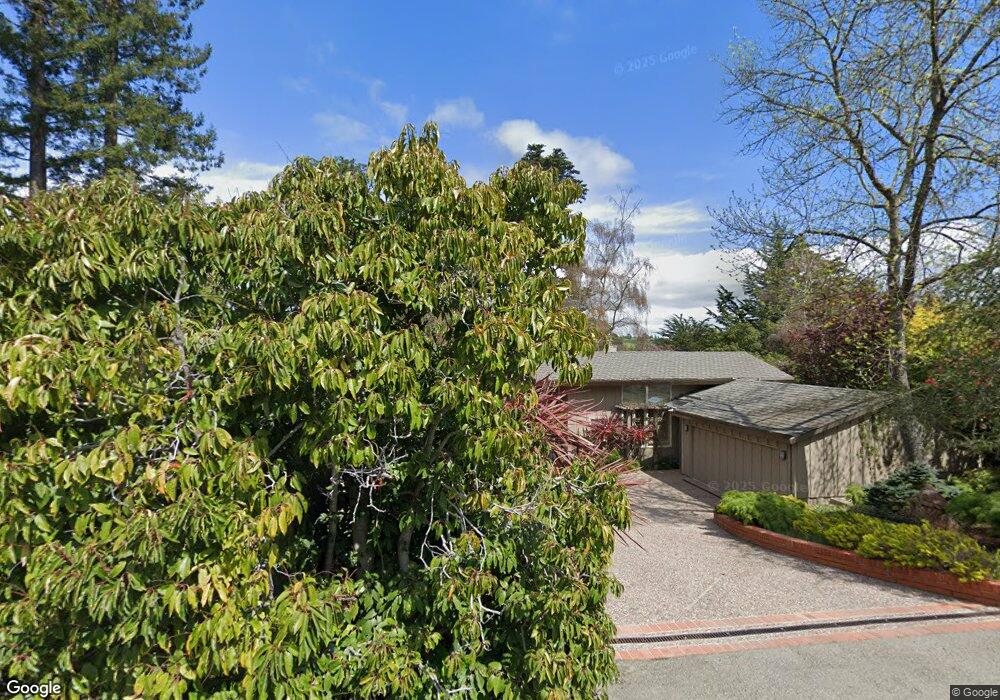
651 Vistamont Ave Berkeley, CA 94708
Berkeley Hills NeighborhoodEstimated Value: $1,774,000 - $2,851,000
5
Beds
4
Baths
2,818
Sq Ft
$796/Sq Ft
Est. Value
About This Home
This home is located at 651 Vistamont Ave, Berkeley, CA 94708 and is currently estimated at $2,242,018, approximately $795 per square foot. 651 Vistamont Ave is a home located in Alameda County with nearby schools including Cragmont Elementary School, Berkeley Arts Magnet at Whittier School, and Washington Elementary School.
Ownership History
Date
Name
Owned For
Owner Type
Purchase Details
Closed on
Jan 10, 2013
Sold by
Kirshman Deborah
Bought by
Kirshman David
Current Estimated Value
Purchase Details
Closed on
Jun 20, 2005
Sold by
Kirshman David K and Kirshman Deborah L
Bought by
Kirshman David K and Kirshman Deborah L
Create a Home Valuation Report for This Property
The Home Valuation Report is an in-depth analysis detailing your home's value as well as a comparison with similar homes in the area
Home Values in the Area
Average Home Value in this Area
Purchase History
| Date | Buyer | Sale Price | Title Company |
|---|---|---|---|
| Kirshman David | -- | Old Republic Title Company | |
| Kirshman David K | -- | -- |
Source: Public Records
Tax History
| Year | Tax Paid | Tax Assessment Tax Assessment Total Assessment is a certain percentage of the fair market value that is determined by local assessors to be the total taxable value of land and additions on the property. | Land | Improvement |
|---|---|---|---|---|
| 2025 | $18,660 | $1,049,606 | $186,462 | $870,144 |
| 2024 | $18,660 | $1,028,890 | $182,806 | $853,084 |
| 2023 | $18,199 | $1,015,582 | $179,222 | $836,360 |
| 2022 | $18,290 | $988,671 | $175,708 | $819,963 |
| 2021 | $18,305 | $969,149 | $172,263 | $803,886 |
| 2020 | $17,348 | $966,143 | $170,497 | $795,646 |
| 2019 | $16,660 | $947,202 | $167,155 | $780,047 |
| 2018 | $16,320 | $928,633 | $163,878 | $764,755 |
| 2017 | $15,756 | $910,426 | $160,665 | $749,761 |
| 2016 | $15,200 | $892,577 | $157,515 | $735,062 |
| 2015 | $14,962 | $879,174 | $155,150 | $724,024 |
| 2014 | $14,582 | $861,956 | $152,111 | $709,845 |
Source: Public Records
Map
Nearby Homes
- 890 Keeler Ave
- 935 Grizzly Peak Blvd
- 614 Cragmont Ave
- 982 Grizzly Peak Blvd
- 1024 Grizzly Peak Blvd
- 410 Grizzly Peak Blvd
- 1024 Miller Ave
- 479 Kentucky Ave
- 770 Santa Barbara Rd
- 1100 Miller Ave
- 483 Boynton Ave
- 1119 Miller Ave
- 826 Indian Rock Ave
- 385 Vermont Ave
- 265 Purdue Ave
- 589 San Luis Rd
- 1106 Cragmont Ave
- 290 Colgate Ave
- 1110 Sterling Ave
- 1123 Park Hills Rd
- 655 Vistamont Ave
- 648 Wildcat Canyon Rd
- 650 Vistamont Ave
- 657 Vistamont Ave
- 652 Wildcat Canyon Rd
- 636 Wildcat Canyon Rd
- 658 Wildcat Canyon Rd
- 661 Woodmont Ave
- 659 Vistamont Ave
- 651 Woodmont Ave
- 657 Woodmont Ave
- 661 Vistamont Ave
- 660 Wildcat Canyon Rd
- 647 Woodmont Ave
- 634 Wildcat Canyon Rd
- 641 Vistamont Ave
- 669 Woodmont Ave
- 662 Wildcat Canyon Rd
- 665 Vistamont Ave Unit A
Your Personal Tour Guide
Ask me questions while you tour the home.