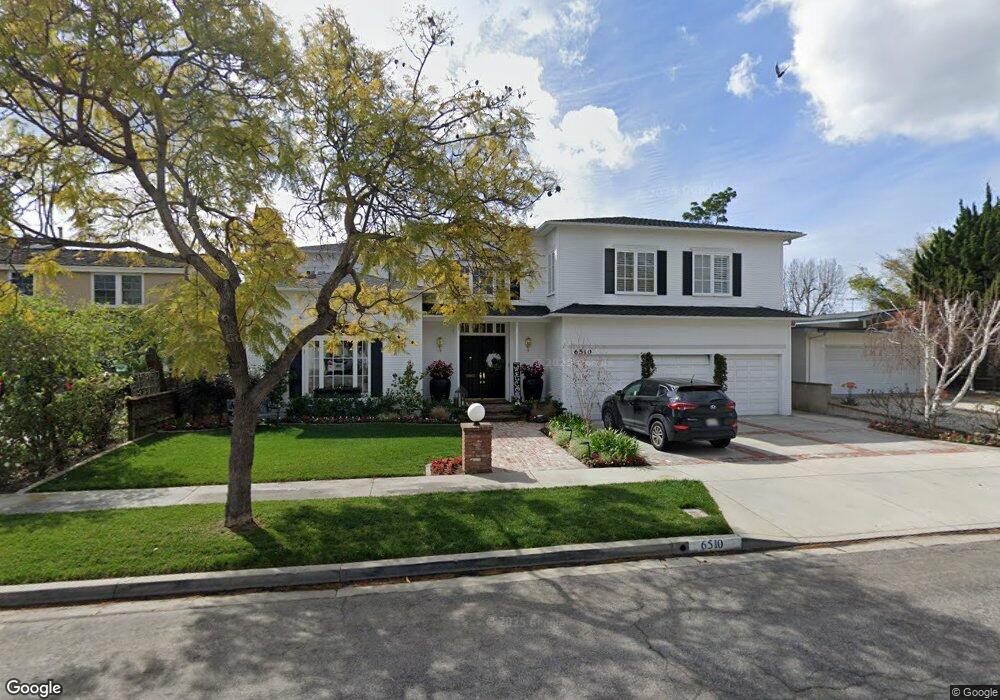
6510 E Mantova St Long Beach, CA 90815
La Marina Estates NeighborhoodEstimated Value: $1,915,206 - $2,756,000
6
Beds
6
Baths
5,394
Sq Ft
$438/Sq Ft
Est. Value
About This Home
This home is located at 6510 E Mantova St, Long Beach, CA 90815 and is currently estimated at $2,360,552, approximately $437 per square foot. 6510 E Mantova St is a home located in Los Angeles County with nearby schools including Tincher Preparatory School, Woodrow Wilson High School, and Los Altos Grace Schools.
Ownership History
Date
Name
Owned For
Owner Type
Purchase Details
Closed on
May 20, 2016
Sold by
Spongberg Sandra D
Bought by
Ahlstrom Thomas H and Fernley Nathan R
Current Estimated Value
Purchase Details
Closed on
Jan 7, 2000
Sold by
Smith Steven C
Bought by
Smith Steven C and Mantova Revocable Trust
Home Financials for this Owner
Home Financials are based on the most recent Mortgage that was taken out on this home.
Original Mortgage
$436,552
Interest Rate
8.55%
Mortgage Type
Seller Take Back
Purchase Details
Closed on
Dec 23, 1998
Sold by
R & S Family Partnership
Bought by
Smith Steven C
Home Financials for this Owner
Home Financials are based on the most recent Mortgage that was taken out on this home.
Original Mortgage
$425,600
Interest Rate
6.73%
Purchase Details
Closed on
Nov 8, 1996
Sold by
Smith Steven C
Bought by
R & S Family Partnership
Purchase Details
Closed on
May 18, 1995
Sold by
Spongberg Roland C and Spongberg Sandra A
Bought by
Smith Steven C
Create a Home Valuation Report for This Property
The Home Valuation Report is an in-depth analysis detailing your home's value as well as a comparison with similar homes in the area
Home Values in the Area
Average Home Value in this Area
Purchase History
| Date | Buyer | Sale Price | Title Company |
|---|---|---|---|
| Ahlstrom Thomas H | -- | None Available | |
| Smith Steven C | $15,000 | -- | |
| Smith Steven C | $532,000 | Fidelity National Title Ins | |
| R & S Family Partnership | -- | -- | |
| Smith Steven C | $137,500 | -- |
Source: Public Records
Mortgage History
| Date | Status | Borrower | Loan Amount |
|---|---|---|---|
| Previous Owner | Smith Steven C | $436,552 | |
| Previous Owner | Smith Steven C | $425,600 | |
| Closed | Smith Steven C | $53,200 |
Source: Public Records
Tax History
| Year | Tax Paid | Tax Assessment Tax Assessment Total Assessment is a certain percentage of the fair market value that is determined by local assessors to be the total taxable value of land and additions on the property. | Land | Improvement |
|---|---|---|---|---|
| 2025 | $13,272 | $1,029,023 | $506,290 | $522,733 |
| 2024 | $13,272 | $1,008,847 | $496,363 | $512,484 |
| 2023 | $13,065 | $989,067 | $486,631 | $502,436 |
| 2022 | $12,277 | $969,675 | $477,090 | $492,585 |
| 2021 | $12,026 | $950,663 | $467,736 | $482,927 |
| 2019 | $11,854 | $922,467 | $453,863 | $468,604 |
| 2018 | $18,404 | $1,479,000 | $765,000 | $714,000 |
| 2016 | $10,428 | $869,264 | $427,687 | $441,577 |
| 2015 | $10,009 | $856,208 | $421,263 | $434,945 |
| 2014 | $9,930 | $839,438 | $413,012 | $426,426 |
Source: Public Records
Map
Nearby Homes
- 1030 Palo Verde Ave
- 1016 Palo Verde Ave
- 6841 E Bacarro St
- 6911 E 10th St
- 905 N Hillside Dr
- 1821 Ostrom Ave
- 6225 Riviera Cir
- 715 N Lariat Cir
- 1881 Hackett Ave
- 6976 E El Cedral St
- 6200 Riviera Cir
- 1837 N Studebaker Rd
- 6368 Riviera Cir
- 1875 Mcnab Ave
- 6200 E Fairbrook St
- 2050 Josie Ave
- 105 Harvard Ln
- 500 Stoneham Ct Unit 102
- 173 College Park Dr
- 1075 Brookline Rd
- 6520 E Mantova St
- 6500 E Mantova St
- 6511 E El Jardin St
- 6490 E Mantova St
- 6530 E Mantova St
- 6501 E El Jardin St
- 6521 E El Jardin St
- 6511 E Mantova St
- 6495 E El Jardin St
- 6521 E Mantova St
- 6531 E El Jardin St
- 6501 E Mantova St
- 6480 E Mantova St
- 6531 E Mantova St
- 6481 E El Jardin St
- 6491 E Mantova St
- 6541 E Mantova St
- 6481 E Mantova St
- 6510 E De Leon St
- 6500 E De Leon St
Your Personal Tour Guide
Ask me questions while you tour the home.