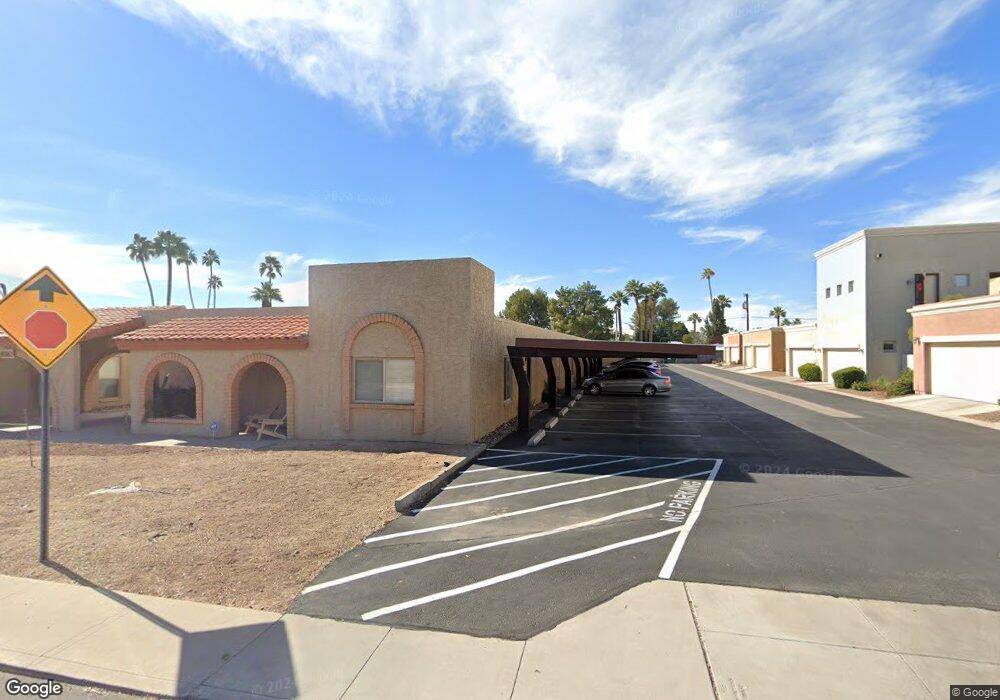
6510 N 3rd Ave Unit 11B Phoenix, AZ 85013
Alhambra NeighborhoodEstimated Value: $244,047 - $280,000
Studio
1
Bath
864
Sq Ft
$306/Sq Ft
Est. Value
About This Home
This home is located at 6510 N 3rd Ave Unit 11B, Phoenix, AZ 85013 and is currently estimated at $264,012, approximately $305 per square foot. 6510 N 3rd Ave Unit 11B is a home located in Maricopa County with nearby schools including Madison Richard Simis School, Madison Meadows School, and Central High School.
Ownership History
Date
Name
Owned For
Owner Type
Purchase Details
Closed on
Sep 15, 2014
Sold by
Weinhandl Georgeann C and Georgeann C Weinhandl Family T
Bought by
Revocabl Weinhandl Georgeann C and Revocabl Georgeann C Weinhandl
Current Estimated Value
Purchase Details
Closed on
Jan 12, 2004
Sold by
Weinhandl Georgeann C
Bought by
Weinhandl Georgeann C and The Georgeann C Weinhandl Family Trust
Purchase Details
Closed on
Jun 30, 1997
Sold by
Vankirk Tracy
Bought by
Weinhandl Georgeann C
Home Financials for this Owner
Home Financials are based on the most recent Mortgage that was taken out on this home.
Original Mortgage
$63,000
Outstanding Balance
$9,293
Interest Rate
7.83%
Mortgage Type
New Conventional
Estimated Equity
$254,719
Purchase Details
Closed on
Apr 13, 1995
Sold by
Vankirk Dale
Bought by
Vankirk Tracy
Create a Home Valuation Report for This Property
The Home Valuation Report is an in-depth analysis detailing your home's value as well as a comparison with similar homes in the area
Home Values in the Area
Average Home Value in this Area
Purchase History
| Date | Buyer | Sale Price | Title Company |
|---|---|---|---|
| Revocabl Weinhandl Georgeann C | -- | None Available | |
| Weinhandl Georgeann C | -- | -- | |
| Weinhandl Georgeann C | $65,000 | Grand Canyon Title Agency In | |
| Vankirk Tracy | -- | United Title Agency |
Source: Public Records
Mortgage History
| Date | Status | Borrower | Loan Amount |
|---|---|---|---|
| Open | Weinhandl Georgeann C | $63,000 |
Source: Public Records
Tax History
| Year | Tax Paid | Tax Assessment Tax Assessment Total Assessment is a certain percentage of the fair market value that is determined by local assessors to be the total taxable value of land and additions on the property. | Land | Improvement |
|---|---|---|---|---|
| 2025 | $755 | $6,585 | -- | -- |
| 2024 | $697 | $6,271 | -- | -- |
| 2023 | $697 | $23,370 | $4,670 | $18,700 |
| 2022 | $675 | $16,630 | $3,320 | $13,310 |
| 2021 | $688 | $16,310 | $3,260 | $13,050 |
| 2020 | $677 | $14,460 | $2,890 | $11,570 |
| 2019 | $662 | $13,220 | $2,640 | $10,580 |
| 2018 | $645 | $9,670 | $1,930 | $7,740 |
| 2017 | $612 | $8,820 | $1,760 | $7,060 |
| 2016 | $590 | $8,520 | $1,700 | $6,820 |
| 2015 | $549 | $5,430 | $1,080 | $4,350 |
Source: Public Records
Map
Nearby Homes
- 344 W Maryland Ave
- 130 W Maryland Ave Unit 4
- 6508 N 5th Ave
- 100 W Maryland Ave Unit P2
- 102 W Maryland Ave Unit C1
- 102 W Maryland Ave Unit F1
- 6624 N 2nd Ave
- 6502 N Central Ave Unit C301
- 6502 N Central Ave Unit A103
- 6502 N Central Ave Unit A101
- 6502 N Central Ave Unit 203
- 6533 N 7th Ave Unit 17
- 6533 N 7th Ave Unit 34
- 6533 N 7th Ave Unit 16
- 514 W Rose Ln
- 6330 N 10th Dr
- 6521 N 2nd St
- 6131 N 8th Ave
- 105 E Claremont St
- 7005 N Barbados Place
- 6510 N 3rd Ave Unit 3
- 6510 N 3rd Ave Unit 6
- 6510 N 3rd Ave Unit 8
- 6510 N 3rd Ave
- 6510 N 3rd Ave Unit 4
- 6510 N 3rd Ave Unit 1
- 6510 N 3rd Ave Unit 1A
- 6510 N 3rd Ave Unit 5A
- 6510 N 3rd Ave Unit 2A
- 6510 N 3rd Ave Unit 10A
- 6510 N 3rd Ave Unit 3A
- 6510 N 3rd Ave Unit 4A
- 6510 N 3rd Ave Unit 9A
- 6510 N 3rd Ave Unit 6A
- 6510 N 3rd Ave Unit 14B
- 6510 N 3rd Ave Unit 13B
- 6510 N 3rd Ave Unit 12B
- 6510 N 3rd Ave Unit 8A
- 6510 N 3rd Ave Unit 7A
- 307 W Herro Ln
Your Personal Tour Guide
Ask me questions while you tour the home.