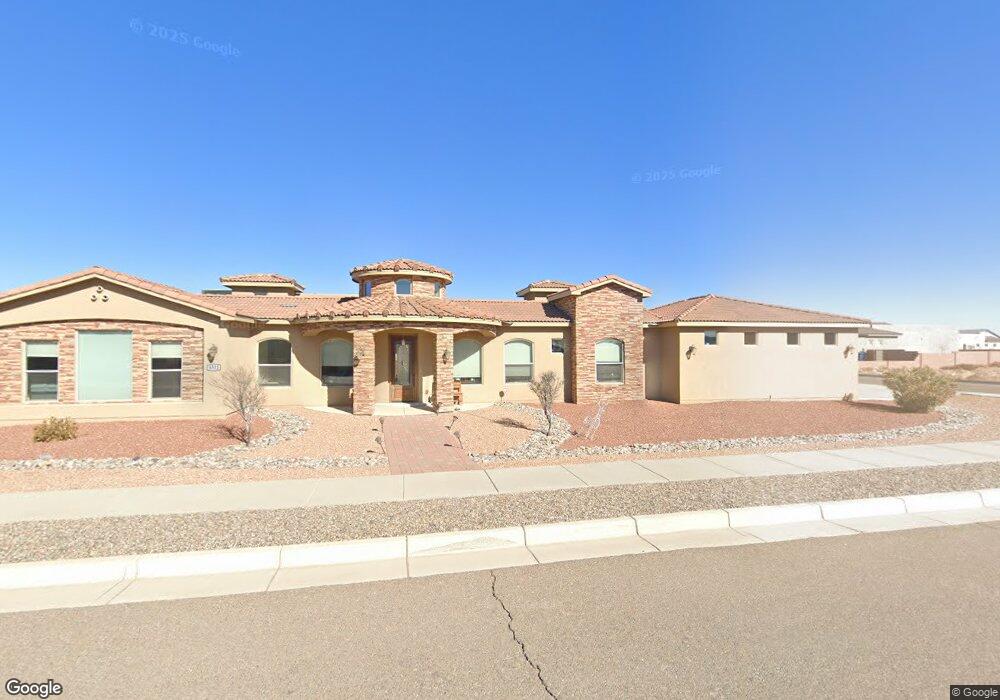
6511 Canavio Rd Albuquerque, NM 87120
Volcano Cliffs NeighborhoodEstimated Value: $866,444 - $1,055,000
4
Beds
3
Baths
4,000
Sq Ft
$234/Sq Ft
Est. Value
About This Home
This home is located at 6511 Canavio Rd, Albuquerque, NM 87120 and is currently estimated at $935,481, approximately $233 per square foot. 6511 Canavio Rd is a home located in Bernalillo County with nearby schools including Sunset View Elementary School, Tony Hillerman Middle School, and Volcano Vista High School.
Ownership History
Date
Name
Owned For
Owner Type
Purchase Details
Closed on
Nov 4, 2022
Sold by
Melendez Jorge Armando and Melendez Tamara Lynn
Bought by
Douglas Jerry Conrad and Douglas Michelle Marie
Current Estimated Value
Purchase Details
Closed on
Mar 8, 2019
Sold by
Huynh Mia
Bought by
Douglas Jerry C and Douglas Michelle M
Home Financials for this Owner
Home Financials are based on the most recent Mortgage that was taken out on this home.
Original Mortgage
$495,900
Interest Rate
4.4%
Mortgage Type
New Conventional
Purchase Details
Closed on
Jun 16, 2017
Sold by
Martinez Anna Y
Bought by
Huynh Mia
Purchase Details
Closed on
Apr 25, 2014
Sold by
Taylor John E and Taylor Cindy J
Bought by
Huynh Mia
Purchase Details
Closed on
Jul 11, 2013
Sold by
Taylor K Paul
Bought by
Taylor John E and Taylor Cindy J
Purchase Details
Closed on
Jul 21, 2003
Sold by
Day Janice Gage
Bought by
Taylor Ganarld
Create a Home Valuation Report for This Property
The Home Valuation Report is an in-depth analysis detailing your home's value as well as a comparison with similar homes in the area
Home Values in the Area
Average Home Value in this Area
Purchase History
| Date | Buyer | Sale Price | Title Company |
|---|---|---|---|
| Douglas Jerry Conrad | -- | Fidelity National Title | |
| Douglas Jerry C | -- | Stewart Title | |
| Huynh Mia | -- | Fidelity Natl Title Ins Co | |
| Huynh Mia | -- | Old Republic Natl Ins Co | |
| Taylor John E | -- | None Available | |
| Taylor Ganarld | -- | Rio Grande Title Company Inc |
Source: Public Records
Mortgage History
| Date | Status | Borrower | Loan Amount |
|---|---|---|---|
| Previous Owner | Douglas Jerry C | $495,900 |
Source: Public Records
Tax History Compared to Growth
Tax History
| Year | Tax Paid | Tax Assessment Tax Assessment Total Assessment is a certain percentage of the fair market value that is determined by local assessors to be the total taxable value of land and additions on the property. | Land | Improvement |
|---|---|---|---|---|
| 2025 | $9,002 | $219,775 | $21,521 | $198,254 |
| 2024 | $9,002 | $213,374 | $20,894 | $192,480 |
| 2023 | $8,853 | $207,160 | $20,286 | $186,874 |
| 2022 | $8,554 | $201,126 | $19,695 | $181,431 |
| 2021 | $8,267 | $195,269 | $19,122 | $176,147 |
| 2020 | $8,132 | $189,581 | $18,565 | $171,016 |
| 2019 | $6,958 | $164,264 | $18,565 | $145,699 |
| 2018 | $6,912 | $164,264 | $18,565 | $145,699 |
| 2017 | $6,901 | $164,264 | $18,565 | $145,699 |
| 2016 | $778 | $16,232 | $16,232 | $0 |
| 2015 | $3,333 | $3,333 | $3,333 | $0 |
| 2014 | $158 | $3,333 | $3,333 | $0 |
| 2013 | -- | $3,333 | $3,333 | $0 |
Source: Public Records
Map
Nearby Homes
- 6500 Papagayo Rd NW
- 6515 Picardia Place NW
- 6501 Picardia Place NW
- 6509 Pato Rd
- 6431 Picardia Place
- 6520 Petirrojo Rd NW
- 6500 Kimmick Dr NW
- 8015 Alto Rey Ct
- 6543 Azor Ln
- 6547 Azor Ln NW
- 6511 Vista Del Prado
- 8204 Ciruela Rd
- 8213 Ciruela Rd
- 6412 Picardia Place NW
- 6501 Arcilla Ln NW
- 8111 Chicory Dr NW
- 7827 Aguila St NW
- 6304 Canavio Rd
- 7804 Compass Dr NW
- 6323 Camino Alto NW
- 6511 Canavio Place
- 6509 Canavio Place NW
- 6512 Papagayo Rd NW
- 6508 Papagayo Rd NW
- 0 Canavio(l14 B9 U18 Vc) NW
- 6512 Canavio Place
- 6505 Canavio Place NW
- 6508 Canavio Place NW
- 6508 Canavio Place
- 6516 Canavio Rd
- 6504 Papagayo Rd NW
- 6520 Canavio Place
- 6520 Canavio Rd
- 6504 Canavio Rd
- 6504 Canavio Place NW
- 6520 Papagayo Rd NW
- 0 Papagayo (L12 B9 U18 Vc) NW
- 6523 Trestle Glen Rd NW
- 6511 Picardia Place
- 6511 Papagayo Rd NW