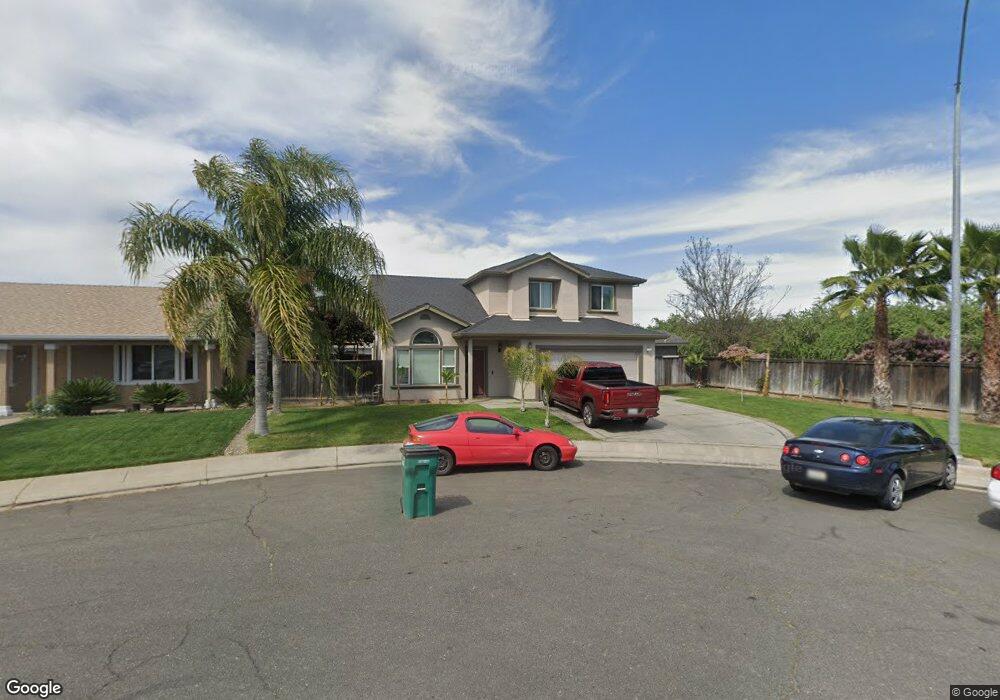
6514 Cal Bears Ct Winton, CA 95388
Estimated Value: $388,986 - $477,000
3
Beds
3
Baths
1,834
Sq Ft
$230/Sq Ft
Est. Value
About This Home
This home is located at 6514 Cal Bears Ct, Winton, CA 95388 and is currently estimated at $420,997, approximately $229 per square foot. 6514 Cal Bears Ct is a home located in Merced County with nearby schools including Winfield Elementary School, Winton Middle School, and Atwater High School.
Ownership History
Date
Name
Owned For
Owner Type
Purchase Details
Closed on
Dec 21, 2009
Sold by
Federal Home Loan Mortgage Corporation
Bought by
Valenzuela Erik V and Macias Jessica
Current Estimated Value
Home Financials for this Owner
Home Financials are based on the most recent Mortgage that was taken out on this home.
Original Mortgage
$127,645
Outstanding Balance
$82,700
Interest Rate
4.77%
Mortgage Type
FHA
Estimated Equity
$338,297
Purchase Details
Closed on
Apr 8, 2009
Sold by
Garcia Jose M
Bought by
Federal Home Loan Mortgage Corporation
Purchase Details
Closed on
Oct 12, 2006
Sold by
Alron Development Llc
Bought by
Garcia Jose M
Home Financials for this Owner
Home Financials are based on the most recent Mortgage that was taken out on this home.
Original Mortgage
$33,200
Interest Rate
6.36%
Mortgage Type
Credit Line Revolving
Create a Home Valuation Report for This Property
The Home Valuation Report is an in-depth analysis detailing your home's value as well as a comparison with similar homes in the area
Home Values in the Area
Average Home Value in this Area
Purchase History
| Date | Buyer | Sale Price | Title Company |
|---|---|---|---|
| Valenzuela Erik V | $130,000 | Lsi Title | |
| Federal Home Loan Mortgage Corporation | $130,000 | None Available | |
| Garcia Jose M | $333,000 | Chicago Title Co |
Source: Public Records
Mortgage History
| Date | Status | Borrower | Loan Amount |
|---|---|---|---|
| Open | Valenzuela Erik V | $127,645 | |
| Previous Owner | Garcia Jose M | $33,200 | |
| Previous Owner | Garcia Jose M | $266,066 |
Source: Public Records
Tax History
| Year | Tax Paid | Tax Assessment Tax Assessment Total Assessment is a certain percentage of the fair market value that is determined by local assessors to be the total taxable value of land and additions on the property. | Land | Improvement |
|---|---|---|---|---|
| 2025 | $1,957 | $167,792 | $10,320 | $157,472 |
| 2024 | $1,957 | $164,503 | $10,118 | $154,385 |
| 2023 | $1,923 | $161,278 | $9,920 | $151,358 |
| 2022 | $1,901 | $158,117 | $9,726 | $148,391 |
| 2021 | $1,889 | $155,018 | $9,536 | $145,482 |
| 2020 | $1,871 | $153,430 | $9,439 | $143,991 |
| 2019 | $1,840 | $150,422 | $9,254 | $141,168 |
| 2018 | $1,803 | $147,473 | $9,073 | $138,400 |
| 2017 | $1,783 | $144,583 | $8,896 | $135,687 |
| 2016 | $1,762 | $141,749 | $8,722 | $133,027 |
| 2015 | $1,742 | $139,620 | $8,591 | $131,029 |
| 2014 | $1,708 | $136,886 | $8,423 | $128,463 |
Source: Public Records
Map
Nearby Homes
- 6617 California St
- 6450 N Winton Way Unit 76
- 6450 N Winton Way Unit 67
- 6450 N Winton Way Unit 93
- 6789 N Cottage St
- 6700 Rex Ave
- 6676 Gertrude Ave
- 474 Aaron Ct
- 464 Aaron Ct
- 7156 N Winton Way
- 7139 Center St
- 7139 Center St Unit 7141
- 6511 Mello Ct
- 6289 Monica Way
- 7316 Edythe Cir
- 7114 Myrtle Ave
- 7411 Louise Ave
- 160 Jeanna Dr
- 6660 Olive Ave
- 7418 W Meadowlark Ct
- 6514 Cal Bears Ct
- 6522 Cal Bears Ct
- 6517 Golden Bobcat Ct
- 6521 Golden Bobcat Ct
- 6534 Cal Bears Ct
- 6519 Cal Bears Ct
- 6535 Golden Bobcat Ct
- 6523 Cal Bears Ct
- 6552 Cal Bears Ct
- 6537 Cal Bears Ct
- 6555 Golden Bobcat Ct
- 6553 Cal Bears Ct
- 6564 Cal Bears Ct
- 6516 Irvine Dr
- 6512 Golden Bobcat Ct
- 6524 Irvine Dr
- 6524 Golden Bobcat Ct
- 6567 Golden Bobcat Ct
- 6532 Golden Bobcat Ct
- 6536 Irvine Dr
Your Personal Tour Guide
Ask me questions while you tour the home.